- United States
- /
- Capital Markets
- /
- NasdaqGS:CME
We Think Some Shareholders May Hesitate To Increase CME Group Inc.'s (NASDAQ:CME) CEO Compensation


Key Insights
- CME Group's Annual General Meeting to take place on 4th of May
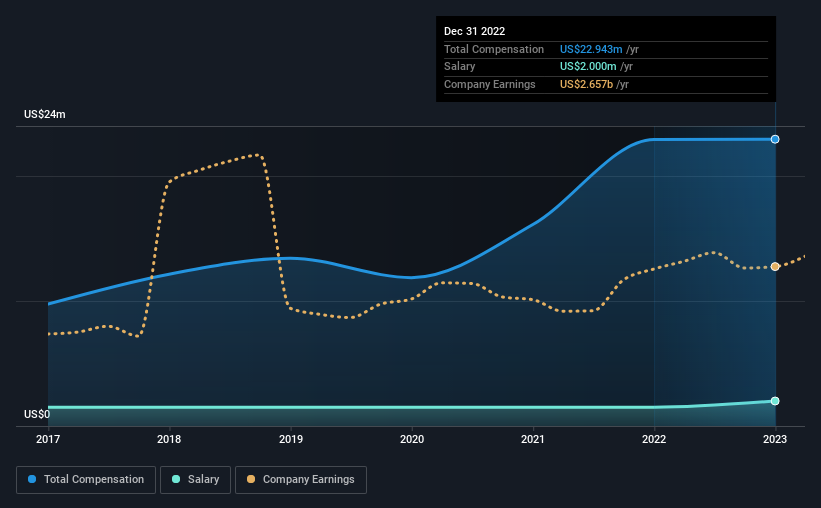
- Salary of US$2.00m is part of CEO Terry Duffy's total remuneration
- Total compensation is 32% above industry average
- CME Group's EPS grew by 5.6% over the past three years while total shareholder return over the past three years was 16%
Performance at CME Group Inc. (NASDAQ:CME) has been reasonably good and CEO Terry Duffy has done a decent job of steering the company in the right direction. This is something shareholders will keep in mind as they cast their votes on company resolutions such as executive remuneration in the upcoming AGM on 4th of May. However, some shareholders may still want to keep CEO compensation within reason.
See our latest analysis for CME Group
Comparing CME Group Inc.'s CEO Compensation With The Industry
According to our data, CME Group Inc. has a market capitalization of US$66b, and paid its CEO total annual compensation worth US$23m over the year to December 2022. That's mostly flat as compared to the prior year's compensation. While we always look at total compensation first, our analysis shows that the salary component is less, at US$2.0m.
In comparison with other companies in the American Capital Markets industry with market capitalizations over US$8.0b, the reported median total CEO compensation was US$17m. Hence, we can conclude that Terry Duffy is remunerated higher than the industry median. Furthermore, Terry Duffy directly owns US$18m worth of shares in the company, implying that they are deeply invested in the company's success.
| Component | 2022 | 2021 | Proportion (2022) |
| Salary | US$2.0m | US$1.5m | 9% |
| Other | US$21m | US$21m | 91% |
| Total Compensation | US$23m | US$23m | 100% |
On an industry level, around 9% of total compensation represents salary and 91% is other remuneration. There isn't a significant difference between CME Group and the broader market, in terms of salary allocation in the overall compensation package. If total compensation is slanted towards non-salary benefits, it indicates that CEO pay is linked to company performance.
CME Group Inc.'s Growth
CME Group Inc.'s earnings per share (EPS) grew 5.6% per year over the last three years. In the last year, its revenue is up 6.9%.
We'd prefer higher revenue growth, but we're happy with the modest EPS growth. Considering these factors we'd say performance has been pretty decent, though not amazing. Moving away from current form for a second, it could be important to check this free visual depiction of what analysts expect for the future.
Has CME Group Inc. Been A Good Investment?
With a total shareholder return of 16% over three years, CME Group Inc. shareholders would, in general, be reasonably content. But they would probably prefer not to see CEO compensation far in excess of the median.
To Conclude...
Seeing that the company has put up a decent performance, only a few shareholders, if any at all, might have questions about the CEO pay in the upcoming AGM. However, any decision to raise CEO pay might be met with some objections from the shareholders given that the CEO is already paid higher than the industry average.
While CEO pay is an important factor to be aware of, there are other areas that investors should be mindful of as well. That's why we did some digging and identified 1 warning sign for CME Group that you should be aware of before investing.
Important note: CME Group is an exciting stock, but we understand investors may be looking for an unencumbered balance sheet and blockbuster returns. You might find something better in this list of interesting companies with high ROE and low debt.
New: AI Stock Screener & Alerts
Our new AI Stock Screener scans the market every day to uncover opportunities.
• Dividend Powerhouses (3%+ Yield)
• Undervalued Small Caps with Insider Buying
• High growth Tech and AI Companies
Or build your own from over 50 metrics.
Have feedback on this article? Concerned about the content? Get in touch with us directly. Alternatively, email editorial-team (at) simplywallst.com.
This article by Simply Wall St is general in nature. We provide commentary based on historical data and analyst forecasts only using an unbiased methodology and our articles are not intended to be financial advice. It does not constitute a recommendation to buy or sell any stock, and does not take account of your objectives, or your financial situation. We aim to bring you long-term focused analysis driven by fundamental data. Note that our analysis may not factor in the latest price-sensitive company announcements or qualitative material. Simply Wall St has no position in any stocks mentioned.
About NasdaqGS:CME
CME Group
Operates contract markets for the trading of futures and options on futures contracts worldwide.
Flawless balance sheet second-rate dividend payer.

