Advertisement
- United States
- /
- Capital Markets
- /
- NasdaqGS:BGC
What Do Recent Earnings Mean for BGC Group’s Valuation in 2025?

Simply Wall St
Reviewed by Bailey Pemberton
Thinking about what to do with BGC Group stock? You’re not alone. The company’s shares have certainly kept things interesting over the past few years, leaving would-be investors and long-term holders on the lookout for cues about where things might be headed next. After a stellar surge of 281.7% over five years (with much of the action coming in the last three years at 209.0%), recent months have seen some turbulence, with shares down 2.9% over the last week and 5.7% over the past 30 days. Still, for those who bought in years ago, these pullbacks have hardly dented the overall gains, and a modest year-to-date increase of 1.5% might appeal to optimists looking for steady progress.
The recent price shifts seem to reflect a market trying to decide whether BGC’s past rocket-fueled growth still has steam or if some of the risk that hung over the company has returned. While there haven’t been any headline-grabbing developments to explain every tick in the chart, broader market dynamics and changing investor sentiment are clearly at play.
Now, to the heart of the matter: is the stock fairly priced? According to a standard valuation scorecard, BGC Group comes in at 0 out of 6 on undervaluation checks, which is not the most encouraging result for value hunters. But before you draw any conclusions, it is worth taking a closer look at how different valuation approaches stack up. And stick with me, because there may be an even better way to judge value than the usual methods.
BGC Group scores just 0/6 on our valuation checks. See what other red flags we found in the full valuation breakdown.Approach 1: BGC Group Excess Returns Analysis
The Excess Returns valuation model evaluates how efficiently a company generates profits above its cost of capital, highlighting sustainable value creation for shareholders. This is particularly insightful for financial firms like BGC Group, where return on equity and book value play pivotal roles in assessing long-term potential.
Here is how the numbers stack up for BGC Group:
- Book Value: $1.96 per share
- Stable Earnings per Share (EPS): $0.24, based on the median Return on Equity from the past 5 years
- Cost of Equity: $0.17 per share
- Excess Return: $0.08 per share, reflecting profits above the cost of equity
- Average Return on Equity: 13.49%
- Stable Book Value: $1.81 per share (sourced from the 5-year median)
Putting all this together, the Excess Returns model estimates an intrinsic value that is significantly lower than the current share price. In fact, the stock is calculated to be a striking 209.8% overvalued by this measure. For value-focused investors, this is a major warning flag. While BGC Group has been profitable, the market appears to be assigning it a premium far above what the fundamentals suggest.
Result: OVERVALUED
Head to the Valuation section of our Company Report for more details on how we arrive at this Fair Value for BGC Group.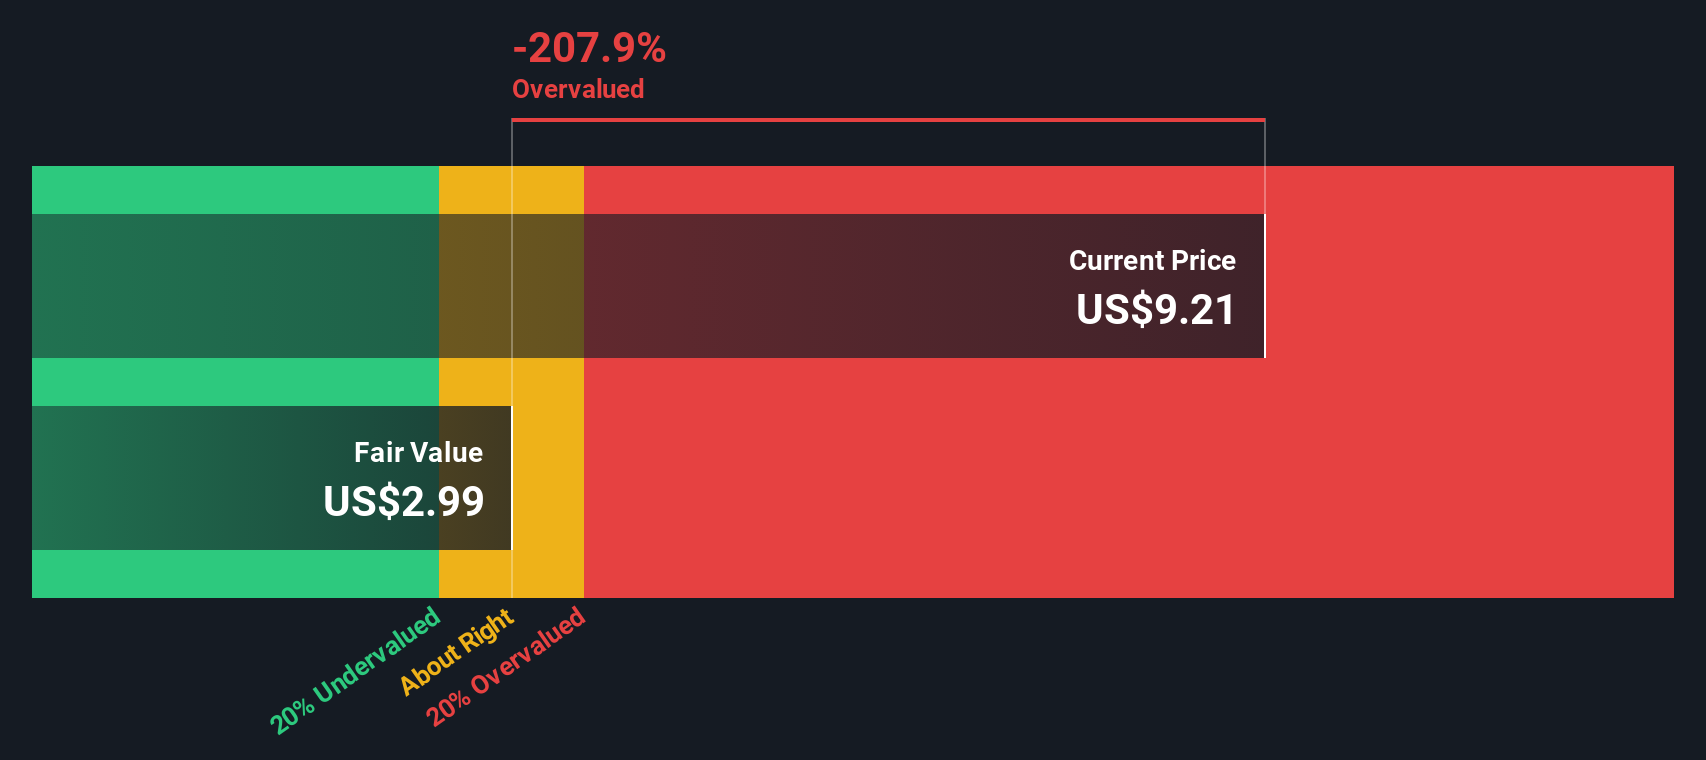
Approach 2: BGC Group Price vs Earnings
The price-to-earnings (PE) ratio is a time-tested valuation metric, especially relevant for companies that are consistently profitable. For businesses like BGC Group, which report stable earnings, the PE ratio provides a straightforward snapshot of how much investors are currently paying for each dollar of earnings. This makes it a go-to yardstick for comparing valuation levels across peers and industry benchmarks.
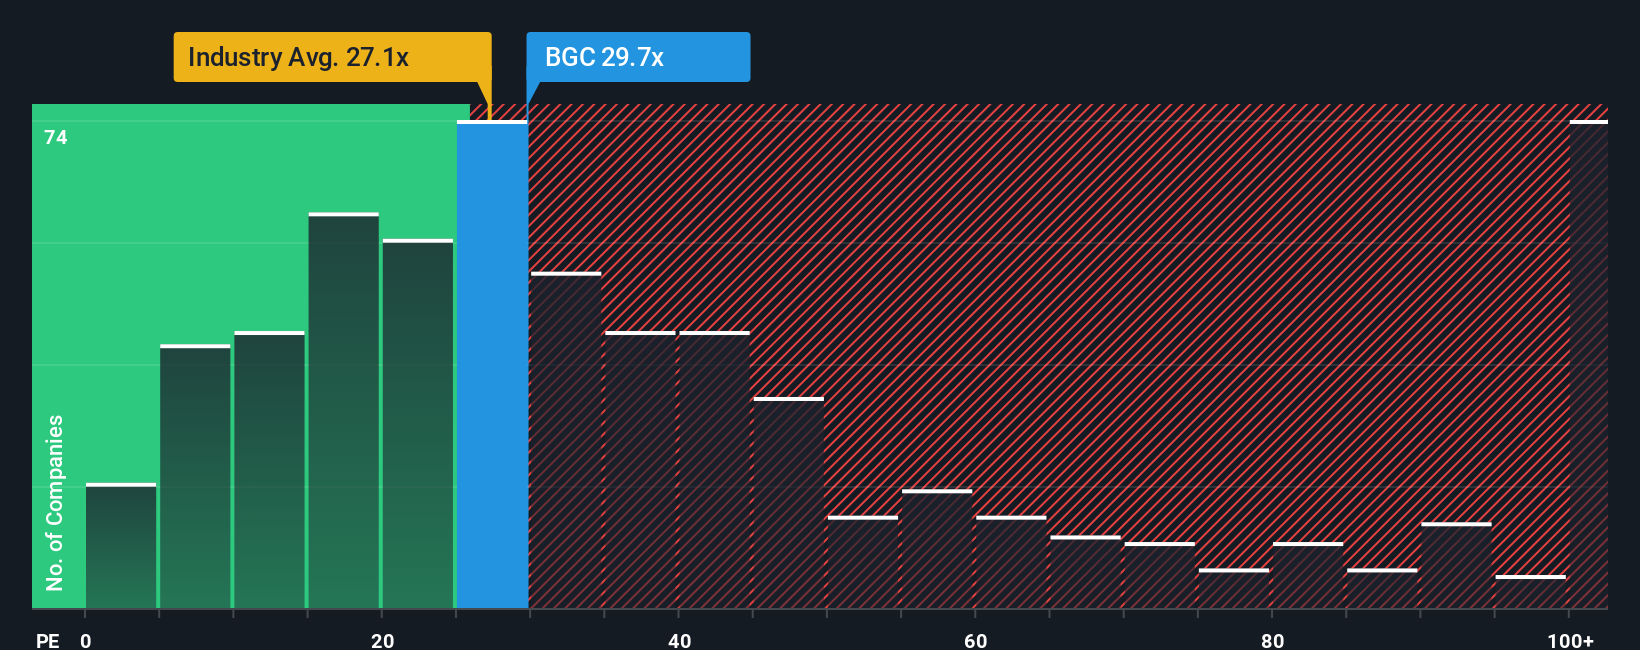
What makes a “normal” or reasonable PE varies. Higher growth expectations and lower risk often justify higher PE ratios, while slower-growing or riskier businesses tend to command lower valuations. In BGC Group's case, the current PE ratio sits at 30.64x. For context, this is notably above both the industry average for Capital Markets companies at 27.17x and the peer average of 7.70x. This premium suggests the market is factoring in strong future performance or awarding a higher quality rating to BGC compared to its peers.
Enter Simply Wall St's proprietary “Fair Ratio,” which estimates the PE you would expect for BGC Group in light of its growth outlook, risks, margins, industry landscape, and market capitalization. Unlike a standard comparison, the Fair Ratio gives a more nuanced, company-specific view by adjusting for details that industry averages usually miss. By measuring where BGC's PE stands relative to its tailored Fair Ratio, investors can decide whether the stock's premium is justified.
Since the difference between BGC Group’s PE ratio and its Fair Ratio is substantial, the stock appears overvalued on this relative basis.
Result: OVERVALUED
Upgrade Your Decision Making: Choose your BGC Group Narrative
Earlier we mentioned that there is an even better way to understand valuation, so let's introduce you to Narratives. Narratives are an intuitive tool that let you connect the company’s story, your perspective on its strategy, risks, and market outlook, to a tailored financial forecast and ultimately a unique assessment of fair value. Available on Simply Wall St’s Community page, Narratives are used by millions of investors to make sense of the numbers through a personal lens by adjusting revenue, earnings, and margin assumptions in line with their investment thesis.
By comparing your calculated Fair Value to the current Price, Narratives help you decide when to buy, sell, or watch a stock based on your outlook. These Narratives automatically update when new information such as news or quarterly results emerges, keeping your view relevant without extra effort. For BGC Group, some investors see digital trading trends and margin expansion driving upside to $14.50 per share, while others worry about cost risks and cyclical headwinds, supporting a much lower valuation. Narratives make it easy to express your expectations and compare them with the current market consensus, offering a smarter, more forward-looking approach to making investment decisions.
Do you think there's more to the story for BGC Group? Create your own Narrative to let the Community know!
This article by Simply Wall St is general in nature. We provide commentary based on historical data and analyst forecasts only using an unbiased methodology and our articles are not intended to be financial advice. It does not constitute a recommendation to buy or sell any stock, and does not take account of your objectives, or your financial situation. We aim to bring you long-term focused analysis driven by fundamental data. Note that our analysis may not factor in the latest price-sensitive company announcements or qualitative material. Simply Wall St has no position in any stocks mentioned.
Valuation is complex, but we're here to simplify it.
Discover if BGC Group might be undervalued or overvalued with our detailed analysis, featuring fair value estimates, potential risks, dividends, insider trades, and its financial condition.
Access Free AnalysisHave feedback on this article? Concerned about the content? Get in touch with us directly. Alternatively, email editorial-team@simplywallst.com
About NasdaqGS:BGC
BGC Group
Operates as a financial brokerage and technology company in the United States, Europe, the Middle East, Africa, and the Asia Pacific.
Solid track record with mediocre balance sheet.
Similar Companies
Market Insights


Advertisement
Community Narratives
America Wants Homegrown Drones — Draganfly Is Ready to Deliver
Fair Value US$9.21|27.4% undervalued
JO
Community Contributor
Cheesecake Factory offers an enticing opportunity for long-term growth by leveraging new concepts
Fair Value US$73.83|25.8% undervalued
ZW
Community Contributor
Coca-Cola’s Intrinsic Value Set to Rise with Fed Rate Cut
Fair Value US$67.50|2.7% undervalued
AL
Community Contributor
Fully Permitted Gold Mine with 50 Baggers Potential 
Fair Value CA$41.00|98.0% undervalued
RO
Community Contributor