- United States
- /
- Hospitality
- /
- NYSE:LTH
Does This Valuation Of Life Time Group Holdings, Inc. (NYSE:LTH) Imply Investors Are Overpaying?


Key Insights
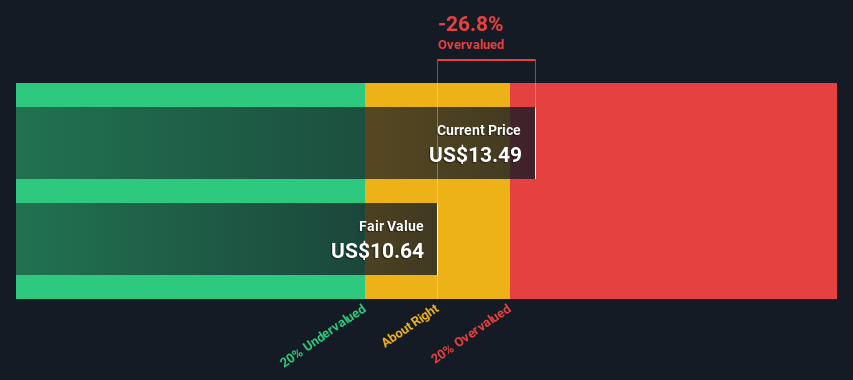
- The projected fair value for Life Time Group Holdings is US$10.64 based on 2 Stage Free Cash Flow to Equity
- Life Time Group Holdings' US$13.49 share price signals that it might be 27% overvalued
- Analyst price target for LTH is US$21.33, which is 101% above our fair value estimate
Today we will run through one way of estimating the intrinsic value of Life Time Group Holdings, Inc. (NYSE:LTH) by projecting its future cash flows and then discounting them to today's value. The Discounted Cash Flow (DCF) model is the tool we will apply to do this. It may sound complicated, but actually it is quite simple!
Remember though, that there are many ways to estimate a company's value, and a DCF is just one method. For those who are keen learners of equity analysis, the Simply Wall St analysis model here may be something of interest to you.
Check out our latest analysis for Life Time Group Holdings
The Calculation
We use what is known as a 2-stage model, which simply means we have two different periods of growth rates for the company's cash flows. Generally the first stage is higher growth, and the second stage is a lower growth phase. To begin with, we have to get estimates of the next ten years of cash flows. Where possible we use analyst estimates, but when these aren't available we extrapolate the previous free cash flow (FCF) from the last estimate or reported value. We assume companies with shrinking free cash flow will slow their rate of shrinkage, and that companies with growing free cash flow will see their growth rate slow, over this period. We do this to reflect that growth tends to slow more in the early years than it does in later years.
A DCF is all about the idea that a dollar in the future is less valuable than a dollar today, and so the sum of these future cash flows is then discounted to today's value:
10-year free cash flow (FCF) estimate
| 2024 | 2025 | 2026 | 2027 | 2028 | 2029 | 2030 | 2031 | 2032 | 2033 | |
| Levered FCF ($, Millions) | -US$13.0m | US$32.0m | US$61.2m | US$100.7m | US$146.9m | US$195.1m | US$241.2m | US$282.8m | US$318.9m | US$349.6m |
| Growth Rate Estimate Source | Analyst x1 | Analyst x1 | Est @ 91.25% | Est @ 64.56% | Est @ 45.88% | Est @ 32.80% | Est @ 23.65% | Est @ 17.24% | Est @ 12.76% | Est @ 9.62% |
| Present Value ($, Millions) Discounted @ 11% | -US$11.7 | US$25.7 | US$44.2 | US$65.2 | US$85.3 | US$102 | US$113 | US$118 | US$120 | US$118 |
("Est" = FCF growth rate estimated by Simply Wall St)
Present Value of 10-year Cash Flow (PVCF) = US$779m
We now need to calculate the Terminal Value, which accounts for all the future cash flows after this ten year period. The Gordon Growth formula is used to calculate Terminal Value at a future annual growth rate equal to the 5-year average of the 10-year government bond yield of 2.3%. We discount the terminal cash flows to today's value at a cost of equity of 11%.
Terminal Value (TV)= FCF2033 × (1 + g) ÷ (r – g) = US$350m× (1 + 2.3%) ÷ (11%– 2.3%) = US$3.9b
Present Value of Terminal Value (PVTV)= TV / (1 + r)10= US$3.9b÷ ( 1 + 11%)10= US$1.3b
The total value, or equity value, is then the sum of the present value of the future cash flows, which in this case is US$2.1b. To get the intrinsic value per share, we divide this by the total number of shares outstanding. Relative to the current share price of US$13.5, the company appears slightly overvalued at the time of writing. Remember though, that this is just an approximate valuation, and like any complex formula - garbage in, garbage out.
Important Assumptions
We would point out that the most important inputs to a discounted cash flow are the discount rate and of course the actual cash flows. Part of investing is coming up with your own evaluation of a company's future performance, so try the calculation yourself and check your own assumptions. The DCF also does not consider the possible cyclicality of an industry, or a company's future capital requirements, so it does not give a full picture of a company's potential performance. Given that we are looking at Life Time Group Holdings as potential shareholders, the cost of equity is used as the discount rate, rather than the cost of capital (or weighted average cost of capital, WACC) which accounts for debt. In this calculation we've used 11%, which is based on a levered beta of 2.000. Beta is a measure of a stock's volatility, compared to the market as a whole. We get our beta from the industry average beta of globally comparable companies, with an imposed limit between 0.8 and 2.0, which is a reasonable range for a stable business.
SWOT Analysis for Life Time Group Holdings
- Debt is well covered by cash flow.
- Interest payments on debt are not well covered.
- Expensive based on P/E ratio and estimated fair value.
- Annual earnings are forecast to grow faster than the American market.
- Significant insider buying over the past 3 months.
- Revenue is forecast to grow slower than 20% per year.
Moving On:
Whilst important, the DCF calculation ideally won't be the sole piece of analysis you scrutinize for a company. It's not possible to obtain a foolproof valuation with a DCF model. Rather it should be seen as a guide to "what assumptions need to be true for this stock to be under/overvalued?" For instance, if the terminal value growth rate is adjusted slightly, it can dramatically alter the overall result. Can we work out why the company is trading at a premium to intrinsic value? For Life Time Group Holdings, we've put together three essential elements you should explore:
- Risks: Case in point, we've spotted 2 warning signs for Life Time Group Holdings you should be aware of, and 1 of them doesn't sit too well with us.
- Future Earnings: How does LTH's growth rate compare to its peers and the wider market? Dig deeper into the analyst consensus number for the upcoming years by interacting with our free analyst growth expectation chart.
- Other Solid Businesses: Low debt, high returns on equity and good past performance are fundamental to a strong business. Why not explore our interactive list of stocks with solid business fundamentals to see if there are other companies you may not have considered!
PS. Simply Wall St updates its DCF calculation for every American stock every day, so if you want to find the intrinsic value of any other stock just search here.
New: AI Stock Screener & Alerts
Our new AI Stock Screener scans the market every day to uncover opportunities.
• Dividend Powerhouses (3%+ Yield)
• Undervalued Small Caps with Insider Buying
• High growth Tech and AI Companies
Or build your own from over 50 metrics.
Have feedback on this article? Concerned about the content? Get in touch with us directly. Alternatively, email editorial-team (at) simplywallst.com.
This article by Simply Wall St is general in nature. We provide commentary based on historical data and analyst forecasts only using an unbiased methodology and our articles are not intended to be financial advice. It does not constitute a recommendation to buy or sell any stock, and does not take account of your objectives, or your financial situation. We aim to bring you long-term focused analysis driven by fundamental data. Note that our analysis may not factor in the latest price-sensitive company announcements or qualitative material. Simply Wall St has no position in any stocks mentioned.
About NYSE:LTH
Life Time Group Holdings
Provides health, fitness, and wellness experiences to a community of individual members in the United States and Canada.
Solid track record with reasonable growth potential.
Similar Companies
Market Insights

Community Narratives


