Advertisement
- United States
- /
- Hospitality
- /
- NYSE:EAT
Are Digital Upgrades and Menu Changes Enough to Lift Brinker International in 2025?

Simply Wall St
Reviewed by Bailey Pemberton
Wondering whether to buy, hold, or wait on Brinker International stock? You are not alone. This restaurant giant has been quietly on the move, and its performance over the past few years demands a closer look. Recently closing at $133.46, Brinker International has turned plenty of heads with a 1.1% gain over the past week. While the last month has seen a slight dip of 2.1% and the year-to-date return stands at -3.1%, these short-term numbers are only half the story. In fact, Brinker’s stock has skyrocketed 43.6% in the past year and a staggering 330.2% over three years, underscoring why investors keep coming back to their math worksheets with this stock in focus.
Recent news paints a clear picture: strategic menu innovations and digital expansion have both drawn industry buzz and contributed to perceptions that Brinker can keep delivering even in a challenging market. You may have seen coverage about new loyalty programs and partnerships. These are subtle shifts that signal management’s confidence in growth, and that investors have not ignored.
The real clincher? When measuring Brinker's value using six standard methods, the company scores a solid 6 out of 6 for being undervalued, a figure that is rare in today’s overheated market. But while these numbers are compelling, they are just the start. Let us break down each valuation approach and, further on, touch on a perspective that could matter even more to your decision-making.
Approach 1: Brinker International Discounted Cash Flow (DCF) Analysis
The Discounted Cash Flow (DCF) model aims to determine a company's intrinsic value by projecting its future cash flows and then discounting them back to their value in today's dollars. This approach provides an estimate of what Brinker International is truly worth based on its expected cash generation capabilities.
Brinker International has reported a recent Free Cash Flow (FCF) of $428.2 Million. Analysts have forecast this to rise in the coming years, with a projected FCF of $497.5 Million in 2027. Beyond that, further projections, extrapolated by Simply Wall St, suggest that FCFs will continue growing, reaching about $690.5 Million in 2035.
Using its 2 Stage Free Cash Flow to Equity model, the DCF analysis calculates an intrinsic fair value for Brinker International at $192.99 per share. With the stock currently trading at $133.46, this model indicates a 30.8% discount to fair value, signaling the shares are significantly undervalued based on projected cash flows.
Result: UNDERVALUED
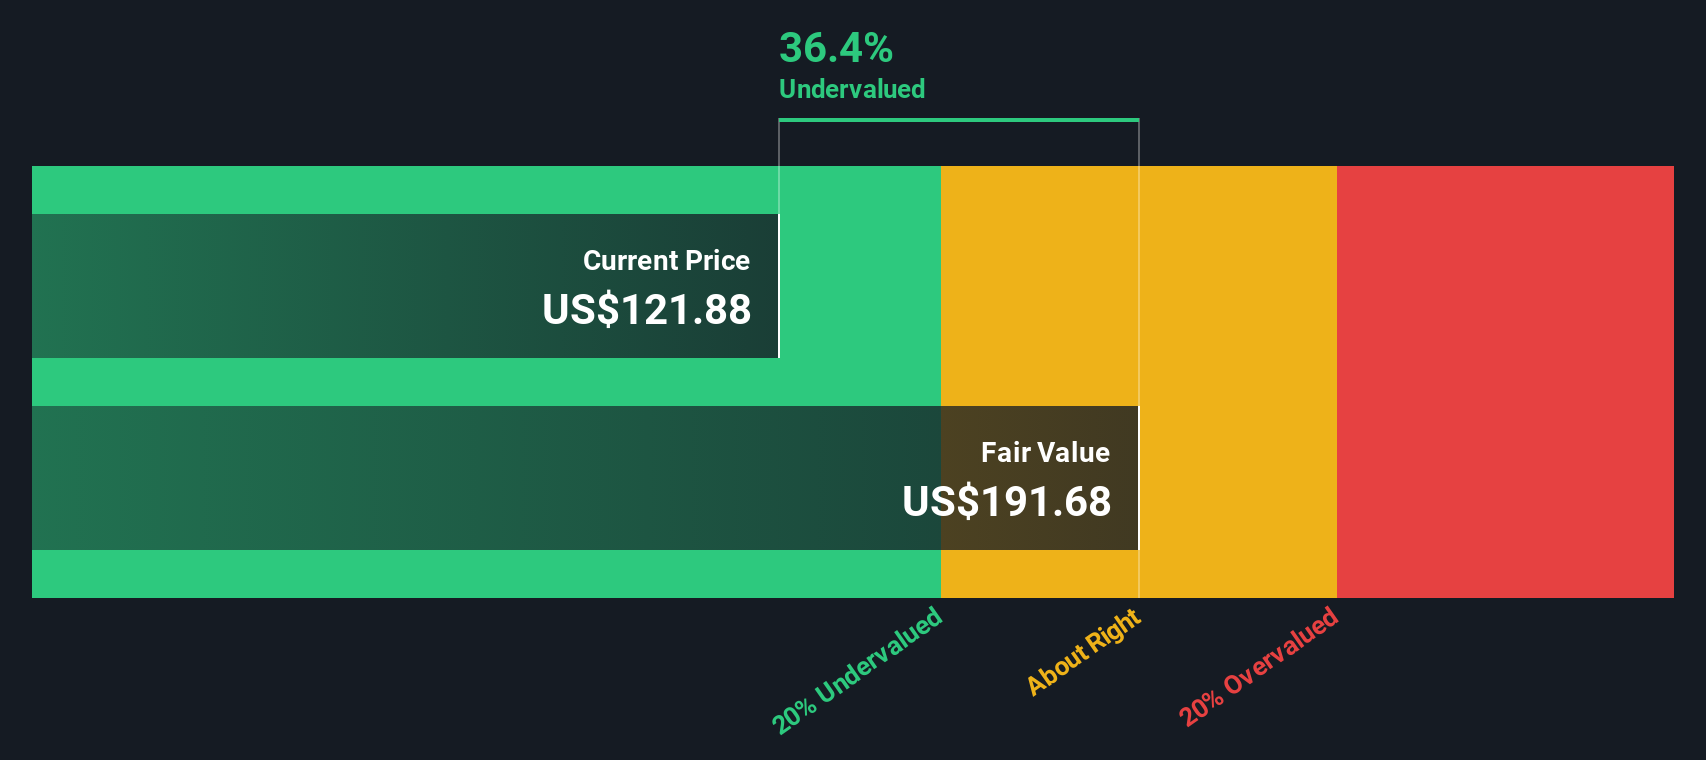
Our Discounted Cash Flow (DCF) analysis suggests Brinker International is undervalued by 30.8%. Track this in your watchlist or portfolio, or discover more undervalued stocks.
Approach 2: Brinker International Price vs Earnings
The Price-to-Earnings (PE) ratio is especially useful for valuing profitable companies like Brinker International, as it shows how much investors are willing to pay for each dollar of earnings. It is a quick way to gauge whether a stock is expensive or cheap relative to its profit-generating power.
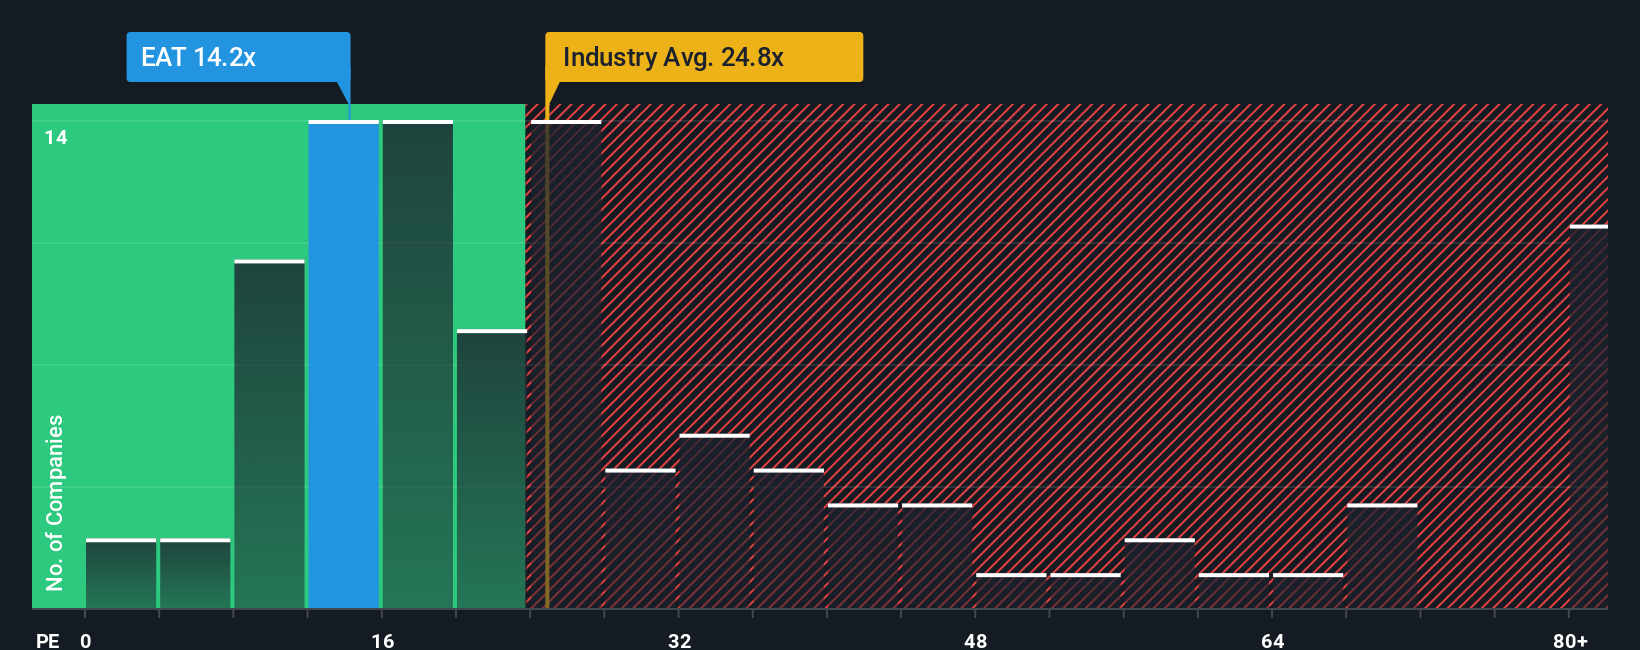
Typically, higher growth expectations or lower risk justify a higher PE ratio. Slower growth or higher risk pull that "normal" or "fair" multiple downward. Brinker International currently trades at a PE ratio of 15.5x. This is notably below the Hospitality industry average of 24.2x and well under the peer group average of 78.9x, signaling a potentially modest market outlook or overlooked upside.
Simply Wall St’s "Fair Ratio" framework refines things further, moving beyond crude peer or industry comparisons. By weighing factors like Brinker’s unique earnings growth outlook, profit margins, and overall market context, it estimates a fair PE of 23.3x for Brinker. This approach is more nuanced, since it flexibly adjusts for the traits that matter most to long-term returns.
Comparing Brinker's actual PE of 15.5x with the Fair Ratio of 23.3x points to the stock being attractively undervalued at current levels. The gap underscores potential for price appreciation if the market re-rates the stock closer to its underlying strengths.
Result: UNDERVALUED
PE ratios tell one story, but what if the real opportunity lies elsewhere? Discover companies where insiders are betting big on explosive growth.
Upgrade Your Decision Making: Choose your Brinker International Narrative
Earlier we mentioned that there is an even better way to understand valuation, so let us introduce you to Narratives. A Narrative is your opportunity to tell the story behind the numbers, blending your unique perspective on Brinker International with your own fair value and estimates for its future revenue, earnings, and margins.
Narratives create a powerful link between a company’s big-picture story, a detailed financial forecast, and its resulting fair value. Rather than relying solely on traditional valuation models, Narratives let you build or adopt a forward-looking view that reflects how you think Brinker’s business will evolve. You can then compare your fair value directly to the current share price to inform your buy or sell decision.
Narratives are easy to create and share right on Simply Wall St’s Community page, where millions of investors collaborate and update their views as new news or earnings come in. This means that your Narrative, and those from experts or other users, will always stay relevant, dynamically adjusting to the latest information as the market evolves.
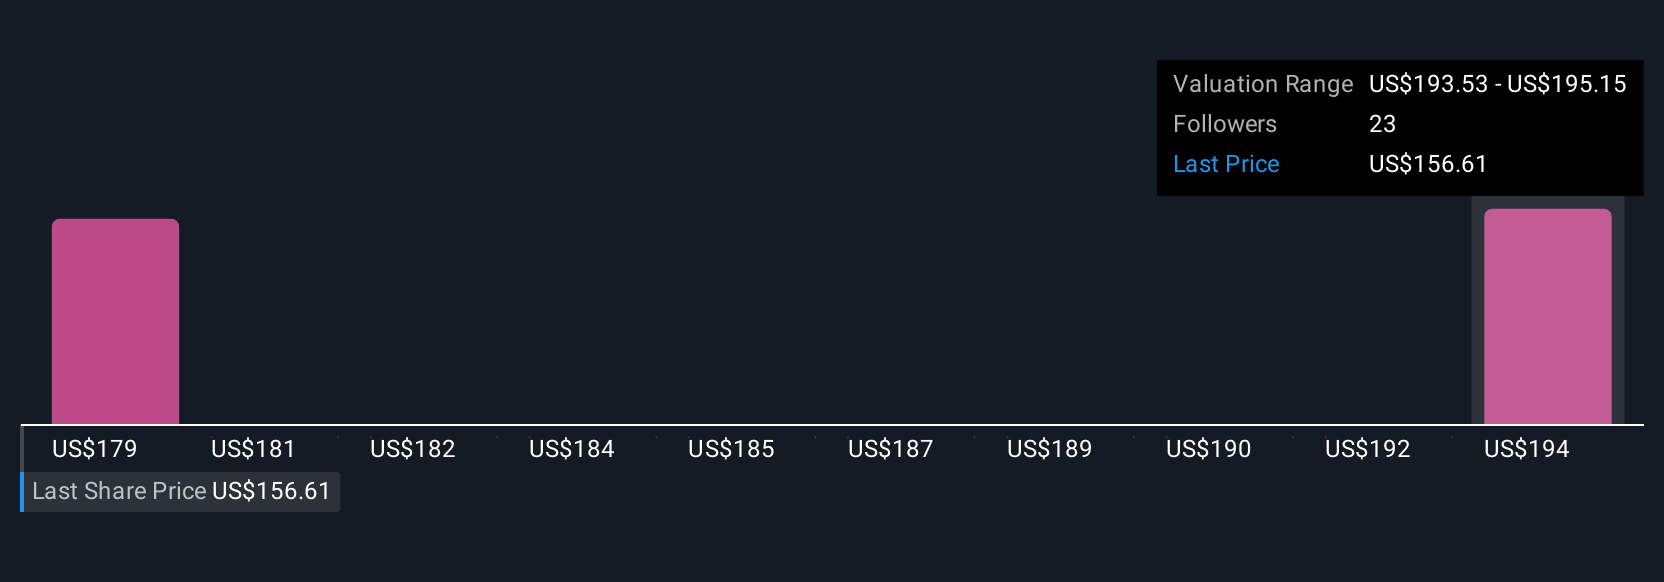
For example, among Brinker International Narratives, some investors expect digital upgrades and menu innovations will propel growth to justify a fair value as high as $215, while others see risks that could cap value around $160. This shows how Narratives capture real differences in conviction and outlook.
Do you think there's more to the story for Brinker International? Create your own Narrative to let the Community know!
This article by Simply Wall St is general in nature. We provide commentary based on historical data and analyst forecasts only using an unbiased methodology and our articles are not intended to be financial advice. It does not constitute a recommendation to buy or sell any stock, and does not take account of your objectives, or your financial situation. We aim to bring you long-term focused analysis driven by fundamental data. Note that our analysis may not factor in the latest price-sensitive company announcements or qualitative material. Simply Wall St has no position in any stocks mentioned.
Valuation is complex, but we're here to simplify it.
Discover if Brinker International might be undervalued or overvalued with our detailed analysis, featuring fair value estimates, potential risks, dividends, insider trades, and its financial condition.
Access Free AnalysisHave feedback on this article? Concerned about the content? Get in touch with us directly. Alternatively, email editorial-team@simplywallst.com
About NYSE:EAT
Brinker International
Owns, develops, operates, and franchises casual dining restaurants in the United States and internationally.
Very undervalued with outstanding track record.
Similar Companies
Market Insights

Advertisement
Community Narratives
Finding The True Value Of A Logistics Powerhouse
Fair Value US$95.21|7.5% undervalued
NV
Community Contributor
Paradigm Biopharmaceuticals Will Lead Osteoarthritis Treatment with Zilosul's FDA Success
Fair Value AU$5.50|91.8% undervalued
AM
Community Contributor
Barrick Mining (ABX:CA): A Gold Hedge against a U.S. Shutdown
Fair Value CA$60.00|26.4% undervalued
GM
Community Contributor