Advertisement
- United States
- /
- Hospitality
- /
- NYSE:CAVA
Assessing CAVA After Shares Drop 45% and Analyst DCF Model Points to Caution

Simply Wall St
Reviewed by Bailey Pemberton
If you are sitting on the fence about CAVA Group stock right now, you are certainly not alone. The stock has given investors quite a ride lately, swinging from sharp declines earlier this year to a bit of stabilization in the past month. After a tough year-to-date drop of 45.0%, and a 52.8% slide over the past year, you may be wondering if the worst is finally priced in, or whether more volatility lies ahead. Over the last week, shares dipped just 2.6%, and managed to post a tiny 0.4% gain in the past month, hinting that maybe the bleeding is slowing, at least for now.
Why all the movement? CAVA Group operates in a fast-changing market, and investors are still sizing up how the company fits into the evolving restaurant and consumer landscape. There have been some industry shifts and broader market developments influencing sentiment, with investors reassessing both the risks and opportunities in fast-casual dining concepts like CAVA. Has the market gotten too pessimistic, or is it just being realistic about the company’s growth curve?
Here is where fundamentals come into play. CAVA Group’s current value score is 0 out of 6, which means none of the traditional undervaluation checks indicate a bargain at today’s price of $63.36. But before you let that score sway you, it is worth taking a closer look at how valuation actually works, and how each method might tell a different story about the company’s prospects.
Let’s dig into the main valuation approaches analysts use and see how each stacks up for CAVA, while keeping in mind that sometimes, the best way to get the full picture of value goes beyond just the numbers.
CAVA Group scores just 0/6 on our valuation checks. See what other red flags we found in the full valuation breakdown.
Approach 1: CAVA Group Discounted Cash Flow (DCF) Analysis
The Discounted Cash Flow (DCF) model estimates a company's intrinsic value by projecting its future free cash flows and discounting them back to today to reflect their present value. In CAVA Group’s case, analysts use a 2 Stage Free Cash Flow to Equity model, which means forecasting cash flows for several years, then making assumptions beyond that period to capture long-term growth.
CAVA Group’s latest reported Free Cash Flow stands at $11.45 million. Analyst projections suggest significant growth is expected, with free cash flow forecasted to reach $195.0 million by 2029. After that, further cash flow growth up to 2035 is extrapolated based on historical and industry data. All projections are calculated in US dollars. According to Simply Wall St, the projections extend beyond the period of direct analyst coverage using reasonable growth rates.
After discounting these future cash flows back to their present value, the model estimates CAVA Group’s intrinsic value per share at $37.49. With shares currently trading at $63.36, this suggests the stock is around 69% overvalued based on DCF calculations.
Result: OVERVALUED
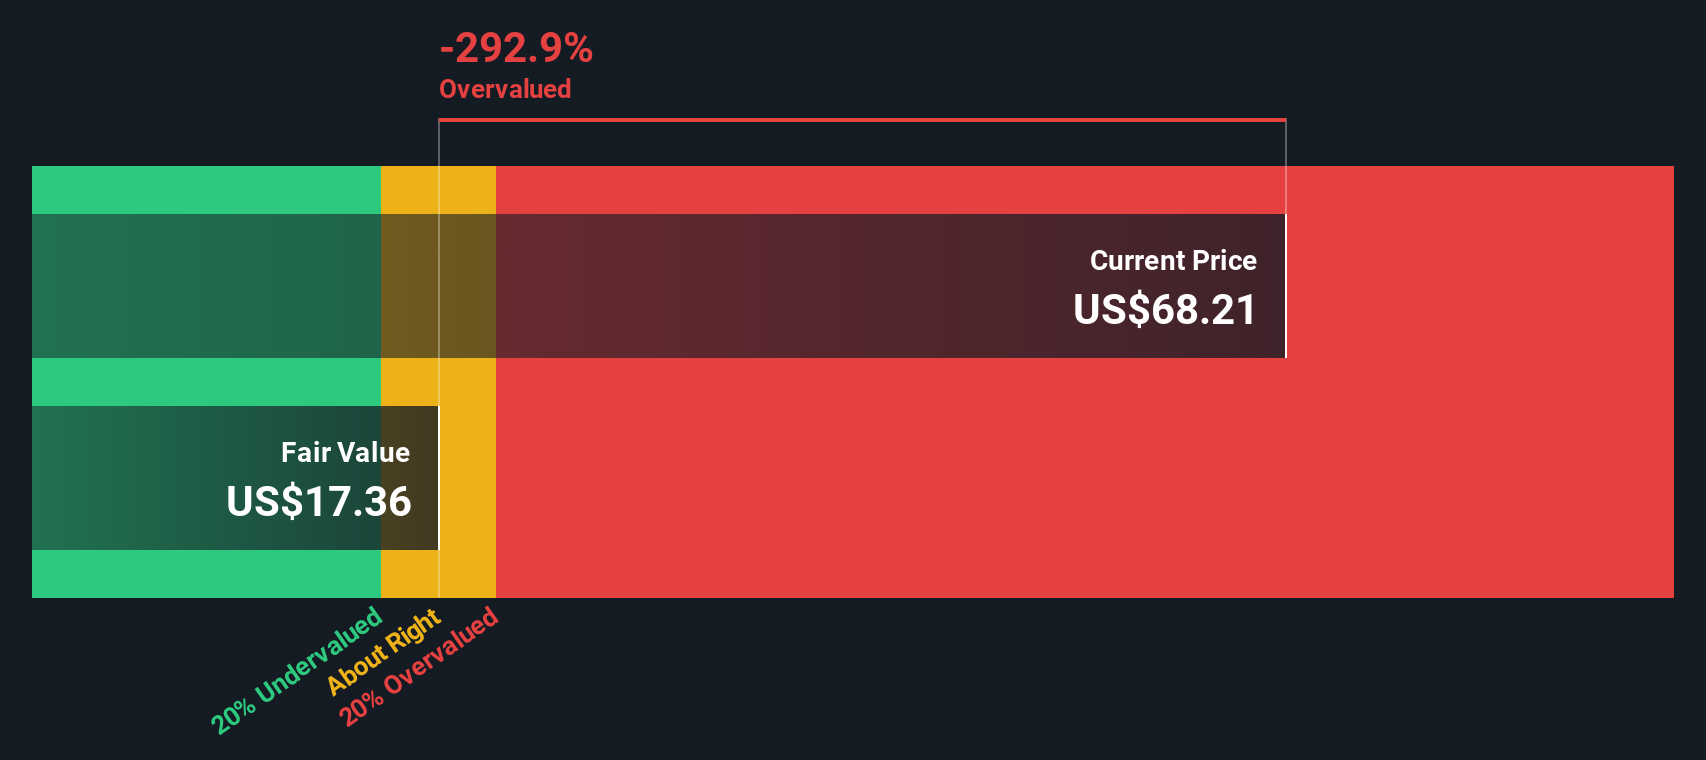
Our Discounted Cash Flow (DCF) analysis suggests CAVA Group may be overvalued by 69.0%. Find undervalued stocks or create your own screener to find better value opportunities.
Approach 2: CAVA Group Price vs Earnings
The Price-to-Earnings (PE) ratio is often the go-to valuation metric for profitable companies because it tells us how much investors are paying for each dollar of a company’s earnings. A higher PE ratio can be justified if strong growth is expected, or if a company has a leading position and fewer risks. Conversely, when growth is slowing or uncertainties are rising, a lower PE ratio tends to be seen as “fair.”
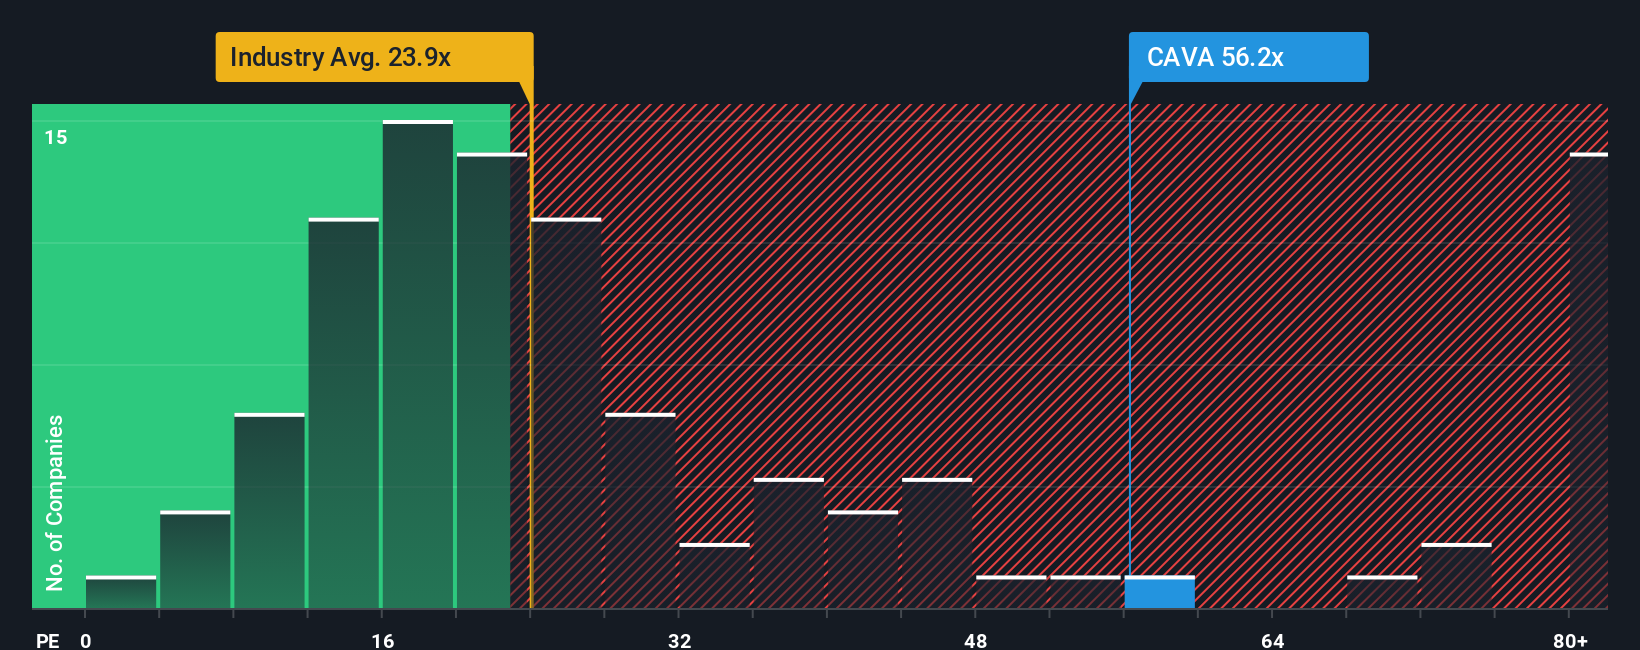
CAVA Group’s current PE ratio stands at 52.2x, which is notably higher than both the Hospitality industry average of 23.4x and its peer group average of 50.5x. This suggests investors are expecting CAVA to outpace its peers in terms of earnings growth, profitability, or strategic positioning.
However, Simply Wall St’s proprietary “Fair Ratio” takes a more nuanced approach. Instead of just comparing basic averages, it factors in specifics like expected earnings growth, profit margins, industry dynamics, market capitalization, and company-specific risks to determine what a “fair” PE ratio really should be for CAVA Group. For this stock, the Fair Ratio is calculated at 22.1x. This is much lower than the actual PE, underscoring that, even after accounting for CAVA’s strengths and outlook, the current share price looks expensive relative to earnings power.
Result: OVERVALUED
PE ratios tell one story, but what if the real opportunity lies elsewhere? Discover companies where insiders are betting big on explosive growth.
Upgrade Your Decision Making: Choose your CAVA Group Narrative
Earlier we mentioned that there is an even better way to understand valuation, so let us introduce you to Narratives. Narratives are your chance to tell the complete story behind a stock, combining your personal viewpoint on the company's prospects with assumptions for things like future revenue, earnings, and fair value. Instead of focusing solely on ratios or numbers, a Narrative connects the company’s story and future potential directly to a financial forecast, and then ties it all back to a fair value estimate.
Narratives are an intuitive, accessible tool available to every investor through the Simply Wall St Community page, already used by millions. By easily comparing your chosen Narrative’s Fair Value with the market Price, you can decide if now is the right time to buy, hold, or sell. Plus, Narratives continuously update as fresh news or earnings data arrives. This helps ensure your perspective remains relevant as the story evolves.
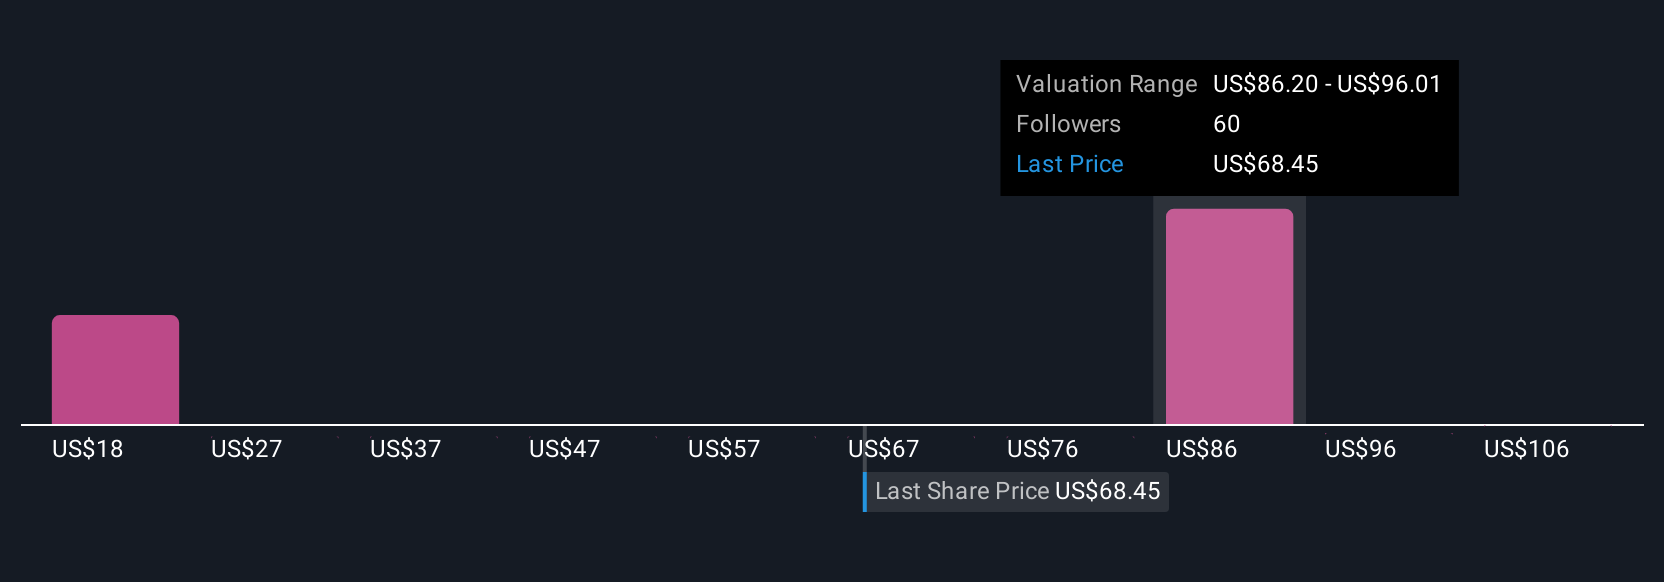
For example, CAVA Group’s most optimistic Narrative sees expansion to 1,000 locations fueling sustained growth and higher margins. The most conservative Narrative warns that rapid expansion and competition could squeeze profits and limit upside. With Narratives, you can see all these perspectives, stress test your own assumptions, and invest with clarity and confidence.
Do you think there's more to the story for CAVA Group? Create your own Narrative to let the Community know!
This article by Simply Wall St is general in nature. We provide commentary based on historical data and analyst forecasts only using an unbiased methodology and our articles are not intended to be financial advice. It does not constitute a recommendation to buy or sell any stock, and does not take account of your objectives, or your financial situation. We aim to bring you long-term focused analysis driven by fundamental data. Note that our analysis may not factor in the latest price-sensitive company announcements or qualitative material. Simply Wall St has no position in any stocks mentioned.
New: AI Stock Screener & Alerts
Our new AI Stock Screener scans the market every day to uncover opportunities.
• Dividend Powerhouses (3%+ Yield)
• Undervalued Small Caps with Insider Buying
• High growth Tech and AI Companies
Or build your own from over 50 metrics.
Have feedback on this article? Concerned about the content? Get in touch with us directly. Alternatively, email editorial-team@simplywallst.com
About NYSE:CAVA
CAVA Group
Owns and operates a chain of restaurants under the CAVA brand in the United States.
Flawless balance sheet with proven track record.
Similar Companies
Market Insights

Advertisement
Community Narratives
Kodiak AI - a potential 100 bagger opportunity?
Fair Value US$14.00|41.9% undervalued
DA
Community Contributor
A Fair Price for a Great Business Facing Real Threats
Fair Value US$383.06|14.1% undervalued
IM
Community Contributor
AXON And Shopify Integration Will Unlock Global Mobile Advertising
Fair Value US$613.59|1.3% undervalued
AN
Based on Analyst Price Targets