- United States
- /
- Hospitality
- /
- NasdaqGS:SRAD
Does Sportradar Group (NASDAQ:SRAD) Have A Healthy Balance Sheet?


Warren Buffett famously said, 'Volatility is far from synonymous with risk.' It's only natural to consider a company's balance sheet when you examine how risky it is, since debt is often involved when a business collapses. We can see that Sportradar Group AG (NASDAQ:SRAD) does use debt in its business. But should shareholders be worried about its use of debt?
When Is Debt Dangerous?
Debt is a tool to help businesses grow, but if a business is incapable of paying off its lenders, then it exists at their mercy. In the worst case scenario, a company can go bankrupt if it cannot pay its creditors. However, a more common (but still painful) scenario is that it has to raise new equity capital at a low price, thus permanently diluting shareholders. Of course, debt can be an important tool in businesses, particularly capital heavy businesses. The first thing to do when considering how much debt a business uses is to look at its cash and debt together.
Check out our latest analysis for Sportradar Group
How Much Debt Does Sportradar Group Carry?
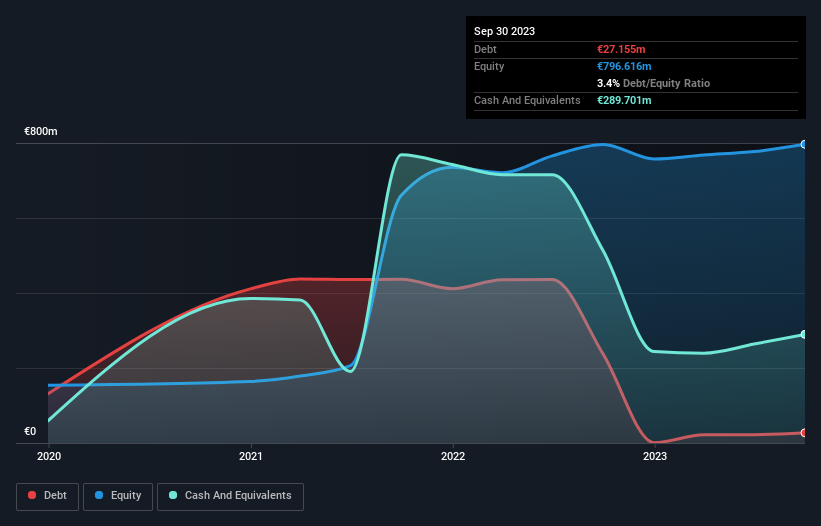
You can click the graphic below for the historical numbers, but it shows that Sportradar Group had €27.2m of debt in September 2023, down from €236.9m, one year before. But it also has €289.7m in cash to offset that, meaning it has €262.5m net cash.
A Look At Sportradar Group's Liabilities
We can see from the most recent balance sheet that Sportradar Group had liabilities of €287.6m falling due within a year, and liabilities of €308.9m due beyond that. Offsetting these obligations, it had cash of €289.7m as well as receivables valued at €126.0m due within 12 months. So its liabilities total €180.8m more than the combination of its cash and short-term receivables.
Given Sportradar Group has a market capitalization of €3.17b, it's hard to believe these liabilities pose much threat. Having said that, it's clear that we should continue to monitor its balance sheet, lest it change for the worse. Despite its noteworthy liabilities, Sportradar Group boasts net cash, so it's fair to say it does not have a heavy debt load!
Notably, Sportradar Group's EBIT launched higher than Elon Musk, gaining a whopping 109% on last year. There's no doubt that we learn most about debt from the balance sheet. But it is future earnings, more than anything, that will determine Sportradar Group's ability to maintain a healthy balance sheet going forward. So if you're focused on the future you can check out this free report showing analyst profit forecasts.
Finally, a company can only pay off debt with cold hard cash, not accounting profits. Sportradar Group may have net cash on the balance sheet, but it is still interesting to look at how well the business converts its earnings before interest and tax (EBIT) to free cash flow, because that will influence both its need for, and its capacity to manage debt. Looking at the most recent three years, Sportradar Group recorded free cash flow of 43% of its EBIT, which is weaker than we'd expect. That's not great, when it comes to paying down debt.
Summing Up
We could understand if investors are concerned about Sportradar Group's liabilities, but we can be reassured by the fact it has has net cash of €262.5m. And we liked the look of last year's 109% year-on-year EBIT growth. So we don't have any problem with Sportradar Group's use of debt. While Sportradar Group didn't make a statutory profit in the last year, its positive EBIT suggests that profitability might not be far away. Click here to see if its earnings are heading in the right direction, over the medium term.
If you're interested in investing in businesses that can grow profits without the burden of debt, then check out this free list of growing businesses that have net cash on the balance sheet.
New: Manage All Your Stock Portfolios in One Place
We've created the ultimate portfolio companion for stock investors, and it's free.
• Connect an unlimited number of Portfolios and see your total in one currency
• Be alerted to new Warning Signs or Risks via email or mobile
• Track the Fair Value of your stocks
Have feedback on this article? Concerned about the content? Get in touch with us directly. Alternatively, email editorial-team (at) simplywallst.com.
This article by Simply Wall St is general in nature. We provide commentary based on historical data and analyst forecasts only using an unbiased methodology and our articles are not intended to be financial advice. It does not constitute a recommendation to buy or sell any stock, and does not take account of your objectives, or your financial situation. We aim to bring you long-term focused analysis driven by fundamental data. Note that our analysis may not factor in the latest price-sensitive company announcements or qualitative material. Simply Wall St has no position in any stocks mentioned.
About NasdaqGS:SRAD
Sportradar Group
Provides sports data services for the sports betting and media industries in the United Kingdom, the United States, Malta, Switzerland, and internationally.
Reasonable growth potential with acceptable track record.
Similar Companies
Market Insights

Community Narratives
