
Advertisement
- United States
- /
- Hospitality
- /
- NasdaqCM:RAVE
A Look At The Intrinsic Value Of Rave Restaurant Group, Inc. (NASDAQ:RAVE)

Key Insights
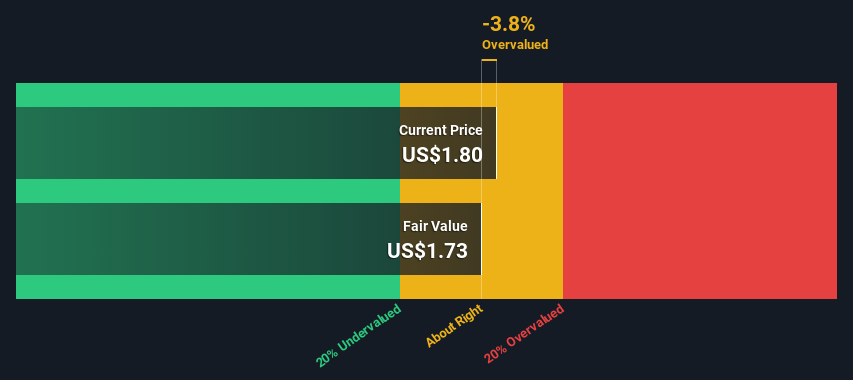
- The projected fair value for Rave Restaurant Group is US$1.73 based on 2 Stage Free Cash Flow to Equity
- Current share price of US$1.80 suggests Rave Restaurant Group is potentially trading close to its fair value
- Peers of Rave Restaurant Group are currently trading on average at a 9.0% discount
In this article we are going to estimate the intrinsic value of Rave Restaurant Group, Inc. (NASDAQ:RAVE) by estimating the company's future cash flows and discounting them to their present value. We will use the Discounted Cash Flow (DCF) model on this occasion. Models like these may appear beyond the comprehension of a lay person, but they're fairly easy to follow.
We generally believe that a company's value is the present value of all of the cash it will generate in the future. However, a DCF is just one valuation metric among many, and it is not without flaws. If you want to learn more about discounted cash flow, the rationale behind this calculation can be read in detail in the Simply Wall St analysis model.
See our latest analysis for Rave Restaurant Group
Step By Step Through The Calculation
We are going to use a two-stage DCF model, which, as the name states, takes into account two stages of growth. The first stage is generally a higher growth period which levels off heading towards the terminal value, captured in the second 'steady growth' period. In the first stage we need to estimate the cash flows to the business over the next ten years. Seeing as no analyst estimates of free cash flow are available to us, we have extrapolate the previous free cash flow (FCF) from the company's last reported value. We assume companies with shrinking free cash flow will slow their rate of shrinkage, and that companies with growing free cash flow will see their growth rate slow, over this period. We do this to reflect that growth tends to slow more in the early years than it does in later years.
Generally we assume that a dollar today is more valuable than a dollar in the future, so we need to discount the sum of these future cash flows to arrive at a present value estimate:
10-year free cash flow (FCF) estimate
| 2024 | 2025 | 2026 | 2027 | 2028 | 2029 | 2030 | 2031 | 2032 | 2033 | |
| Levered FCF ($, Millions) | US$1.65m | US$1.56m | US$1.50m | US$1.48m | US$1.47m | US$1.47m | US$1.48m | US$1.50m | US$1.53m | US$1.55m |
| Growth Rate Estimate Source | Est @ -9.22% | Est @ -5.81% | Est @ -3.42% | Est @ -1.75% | Est @ -0.58% | Est @ 0.24% | Est @ 0.81% | Est @ 1.21% | Est @ 1.49% | Est @ 1.69% |
| Present Value ($, Millions) Discounted @ 7.6% | US$1.5 | US$1.3 | US$1.2 | US$1.1 | US$1.0 | US$1.0 | US$0.9 | US$0.8 | US$0.8 | US$0.7 |
("Est" = FCF growth rate estimated by Simply Wall St)
Present Value of 10-year Cash Flow (PVCF) = US$10m
The second stage is also known as Terminal Value, this is the business's cash flow after the first stage. For a number of reasons a very conservative growth rate is used that cannot exceed that of a country's GDP growth. In this case we have used the 5-year average of the 10-year government bond yield (2.2%) to estimate future growth. In the same way as with the 10-year 'growth' period, we discount future cash flows to today's value, using a cost of equity of 7.6%.
Terminal Value (TV)= FCF2033 × (1 + g) ÷ (r – g) = US$1.6m× (1 + 2.2%) ÷ (7.6%– 2.2%) = US$29m
Present Value of Terminal Value (PVTV)= TV / (1 + r)10= US$29m÷ ( 1 + 7.6%)10= US$14m
The total value, or equity value, is then the sum of the present value of the future cash flows, which in this case is US$25m. In the final step we divide the equity value by the number of shares outstanding. Relative to the current share price of US$1.8, the company appears around fair value at the time of writing. The assumptions in any calculation have a big impact on the valuation, so it is better to view this as a rough estimate, not precise down to the last cent.
Important Assumptions
The calculation above is very dependent on two assumptions. The first is the discount rate and the other is the cash flows. If you don't agree with these result, have a go at the calculation yourself and play with the assumptions. The DCF also does not consider the possible cyclicality of an industry, or a company's future capital requirements, so it does not give a full picture of a company's potential performance. Given that we are looking at Rave Restaurant Group as potential shareholders, the cost of equity is used as the discount rate, rather than the cost of capital (or weighted average cost of capital, WACC) which accounts for debt. In this calculation we've used 7.6%, which is based on a levered beta of 1.083. Beta is a measure of a stock's volatility, compared to the market as a whole. We get our beta from the industry average beta of globally comparable companies, with an imposed limit between 0.8 and 2.0, which is a reasonable range for a stable business.
Looking Ahead:
Although the valuation of a company is important, it ideally won't be the sole piece of analysis you scrutinize for a company. It's not possible to obtain a foolproof valuation with a DCF model. Preferably you'd apply different cases and assumptions and see how they would impact the company's valuation. For instance, if the terminal value growth rate is adjusted slightly, it can dramatically alter the overall result. For Rave Restaurant Group, there are three important factors you should look at:
- Risks: We feel that you should assess the 2 warning signs for Rave Restaurant Group we've flagged before making an investment in the company.
- Other Solid Businesses: Low debt, high returns on equity and good past performance are fundamental to a strong business. Why not explore our interactive list of stocks with solid business fundamentals to see if there are other companies you may not have considered!
- Other Environmentally-Friendly Companies: Concerned about the environment and think consumers will buy eco-friendly products more and more? Browse through our interactive list of companies that are thinking about a greener future to discover some stocks you may not have thought of!
PS. Simply Wall St updates its DCF calculation for every American stock every day, so if you want to find the intrinsic value of any other stock just search here.
New: AI Stock Screener & Alerts
Our new AI Stock Screener scans the market every day to uncover opportunities.
• Dividend Powerhouses (3%+ Yield)
• Undervalued Small Caps with Insider Buying
• High growth Tech and AI Companies
Or build your own from over 50 metrics.
Have feedback on this article? Concerned about the content? Get in touch with us directly. Alternatively, email editorial-team (at) simplywallst.com.
This article by Simply Wall St is general in nature. We provide commentary based on historical data and analyst forecasts only using an unbiased methodology and our articles are not intended to be financial advice. It does not constitute a recommendation to buy or sell any stock, and does not take account of your objectives, or your financial situation. We aim to bring you long-term focused analysis driven by fundamental data. Note that our analysis may not factor in the latest price-sensitive company announcements or qualitative material. Simply Wall St has no position in any stocks mentioned.
About NasdaqCM:RAVE
Rave Restaurant Group
Through its subsidiaries, engages in the operation and franchising of pizza buffet, delivery/carry-out, express restaurants, and ghost kitchens under the Pizza Inn and Pie Five trademarks in the United States and internationally.
Flawless balance sheet with proven track record.
Similar Companies
Market Insights


Advertisement
Community Narratives
Nike's Direct-to-Consumer Focus Will Drive Future Growth
Fair Value US$87.90|22.7% undervalued
UN
Community Contributor
Novo Nordisk will dominate GLP-1 market with Ozempic and Wegovy growth
Fair Value US$89.59|14.2% undervalued
BE
Community Contributor
Rheinmetall could get 20-25% of EU-NATO 3%-GDP defence spending
Fair Value €7.57k|82.8% undervalued
NO
Community Contributor