Advertisement
- United States
- /
- Hospitality
- /
- NasdaqGS:PZZA
Is Papa Johns Stock Pricing In Too Much Optimism After Years of Share Price Declines?

Simply Wall St
Reviewed by Bailey Pemberton
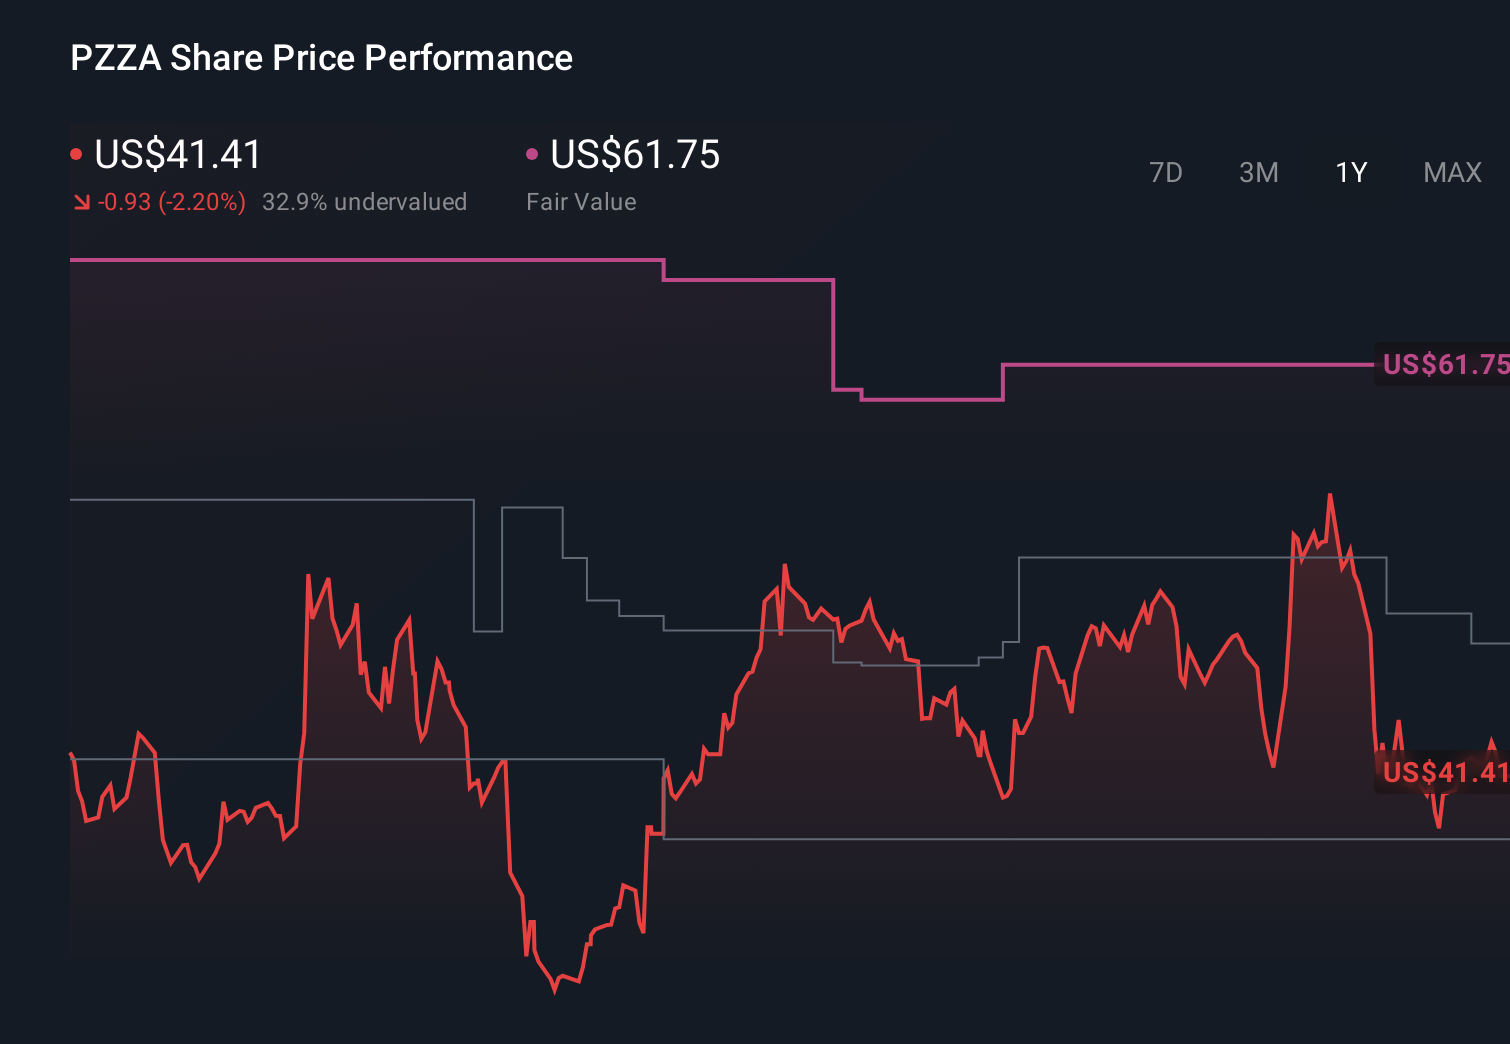
- If you are wondering whether Papa John's International at around $40.96 is a quietly mispriced opportunity or a value trap in plain sight, this breakdown is for you.
- The stock is down about 2.8% over the last week, roughly flat over the past month, and still sitting on a 10.5% slide over the past year and a steep 48.2% drop over three years, which indicates sentiment has been under pressure for a while.
- Recent headlines have focused on Papa John's ongoing strategy tweaks, from sharpening its store footprint and franchise model to leaning harder into digital ordering and delivery partnerships. At the same time, industry commentary keeps circling back to rising input costs and intense pizza chain competition, which helps explain why investors have stayed cautious even as the brand continues to push for a more premium position.
- Right now, Papa John's scores 0/6 on our undervaluation checks, suggesting the market is not obviously mispricing it on the surface. However, the real story becomes clearer when you compare different valuation methods and, later in this article, look at an even deeper way of thinking about what the shares are truly worth.
Papa John's International scores just 0/6 on our valuation checks. See what other red flags we found in the full valuation breakdown.
Approach 1: Papa John's International Discounted Cash Flow (DCF) Analysis
A Discounted Cash Flow, or DCF, model estimates what a company is worth by projecting the cash it can generate in the future and then discounting those cash flows back to today's value.
For Papa John's International, the latest reported free cash flow is about $80.2 million. Analysts and extrapolated estimates from Simply Wall St see free cash flow easing to around $73.6 million by 2026, and then stabilizing in the $70 million to $80 million range over the next decade as modest growth resumes. These projections are all converted into today's dollars using a required rate of return, and then summed to get an intrinsic value per share.
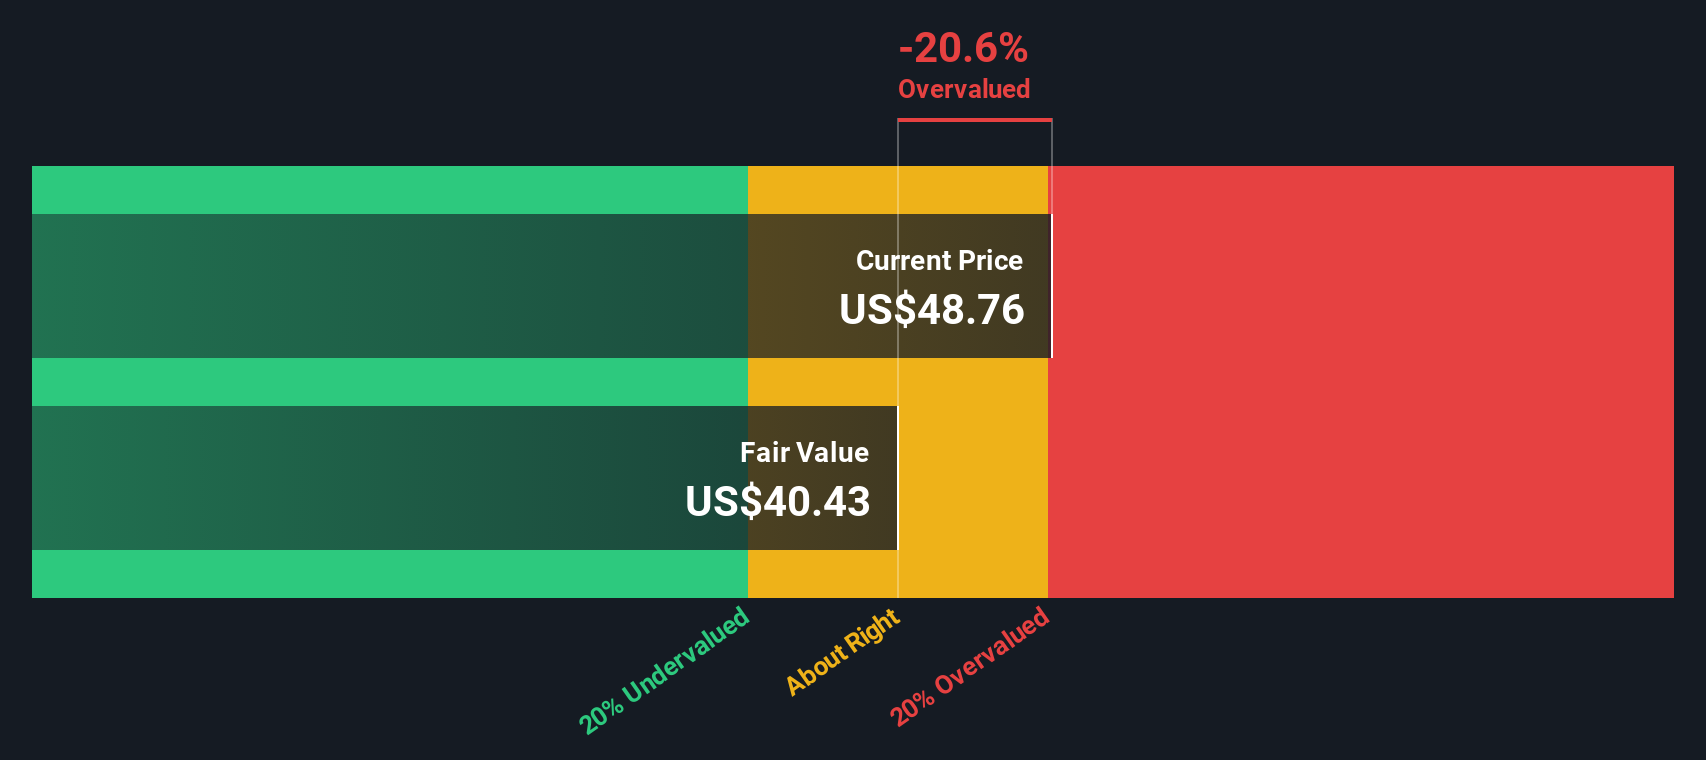
On this basis, the DCF model points to a fair value of roughly $27.38 per share, which implies the stock is about 49.6% above its estimated intrinsic value at the current market price. In other words, under this cash flow based lens, Papa John's looks materially overvalued right now.
Result: OVERVALUED
Our Discounted Cash Flow (DCF) analysis suggests Papa John's International may be overvalued by 49.6%. Discover 903 undervalued stocks or create your own screener to find better value opportunities.
Approach 2: Papa John's International Price vs Earnings
For a mature, profitable business like Papa John's International, the price to earnings, or PE, ratio is a practical way to judge valuation because it ties the share price directly to the profits that shareholders ultimately rely on. A higher PE can be justified when investors expect stronger growth or see the earnings stream as relatively low risk, while slower growth or higher uncertainty usually call for a lower, more conservative multiple.
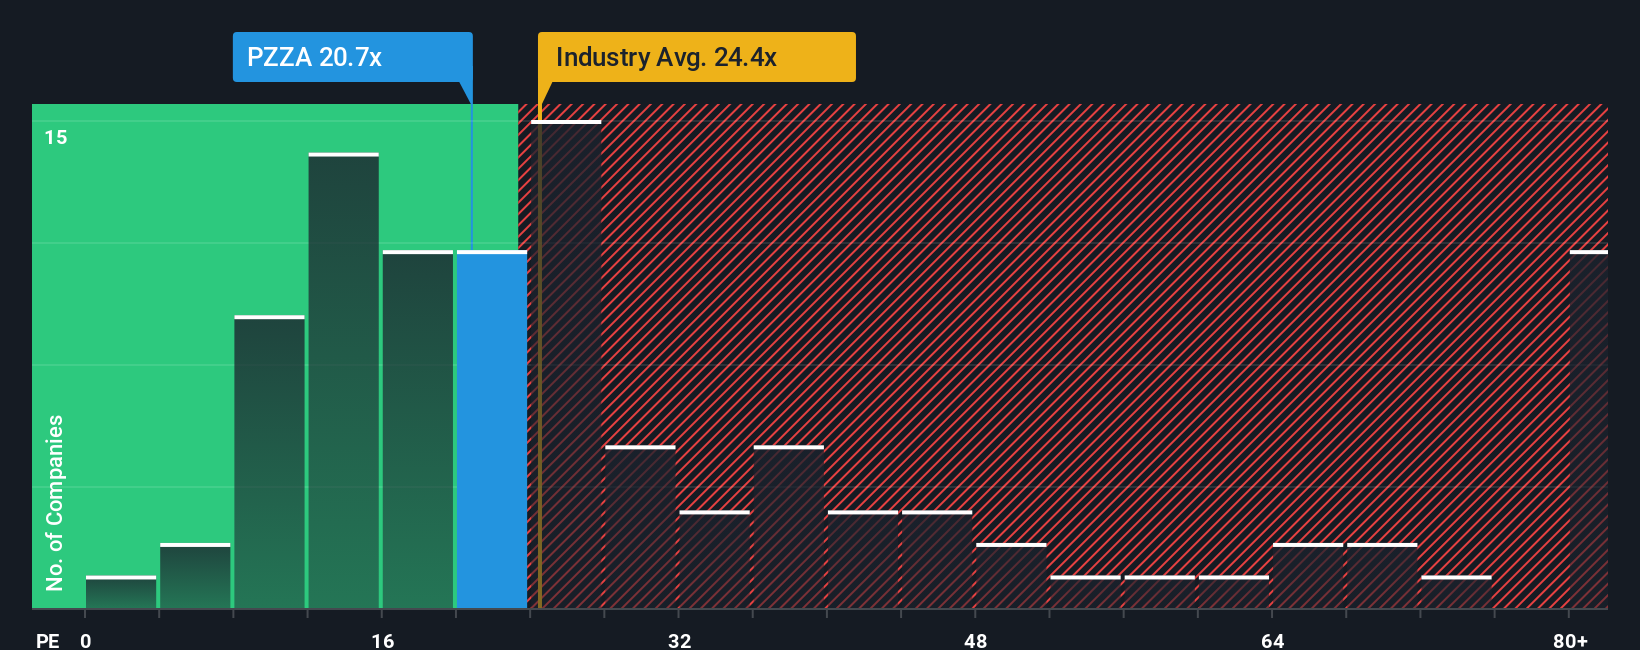
Papa John's currently trades on a PE of about 35.9x, which is well above both the Hospitality industry average of roughly 23.4x and the peer group average of around 13.9x. Simply Wall St also calculates a proprietary Fair Ratio of 33.5x for Papa John's, which is the PE you would expect given its specific mix of earnings growth prospects, profit margins, risk profile, industry positioning and market cap. This Fair Ratio is more tailored than a simple peer or sector comparison because it adjusts for the company’s own fundamentals rather than assuming all pizza or restaurant stocks deserve the same multiple.
With the actual PE of 35.9x sitting above the 33.5x Fair Ratio, the shares look mildly expensive on an earnings based view.
Result: OVERVALUED
PE ratios tell one story, but what if the real opportunity lies elsewhere? Discover 1450 companies where insiders are betting big on explosive growth.
Upgrade Your Decision Making: Choose your Papa John's International Narrative
Earlier we mentioned that there is an even better way to understand valuation, so let us introduce you to Narratives, a simple way to connect your view of Papa John's International with a financial forecast and a fair value estimate. A Narrative is your story about a company turned into numbers, where your assumptions about future revenue, earnings and margins are used to build a forecast and calculate what you believe the stock is really worth. On Simply Wall St, Narratives are available on the Community page and are used by millions of investors as an accessible tool to decide whether to buy, hold or sell by directly comparing their Fair Value to the current share price. Because these Narratives update dynamically when new information like earnings releases, news or buyout rumors appear, your valuation can move with the story rather than lag behind it. For example, one optimistic Narrative for Papa John's might lean into international expansion, cost efficiencies and potential deal activity, resulting in a fair value near $67. A more cautious Narrative could focus on slowing revenue, margin pressure and uncertain growth, leading to an estimate closer to $42. Your own view can sit anywhere along that spectrum.
Do you think there's more to the story for Papa John's International? Head over to our Community to see what others are saying!
This article by Simply Wall St is general in nature. We provide commentary based on historical data and analyst forecasts only using an unbiased methodology and our articles are not intended to be financial advice. It does not constitute a recommendation to buy or sell any stock, and does not take account of your objectives, or your financial situation. We aim to bring you long-term focused analysis driven by fundamental data. Note that our analysis may not factor in the latest price-sensitive company announcements or qualitative material. Simply Wall St has no position in any stocks mentioned.
New: Manage All Your Stock Portfolios in One Place
We've created the ultimate portfolio companion for stock investors, and it's free.
• Connect an unlimited number of Portfolios and see your total in one currency
• Be alerted to new Warning Signs or Risks via email or mobile
• Track the Fair Value of your stocks
Have feedback on this article? Concerned about the content? Get in touch with us directly. Alternatively, email editorial-team@simplywallst.com
About NasdaqGS:PZZA
Papa John's International
Operates and franchises pizza delivery and carryout restaurants under the Papa Johns trademark in the United States, Canada, and internationally.
Established dividend payer with slight risk.
Market Insights

Advertisement
Weekly Picks
WO

woodworthfund on MGP Ingredients ·
THE KINGDOM OF BROWN GOODS: WHY MGPI IS BEING CRUSHED BY INVENTORY & PRIMED FOR RESURRECTION
Fair Value:US$4039.0% undervalued
6 followersusers have followed this narrative
0 commentsusers have commented on this narrative
3 likesusers have liked this narrative
DO


Double_Bubbler on Vertical Aerospace ·
Why Vertical Aerospace (NYSE: EVTL) is Worth Possibly Over 13x its Current Price
Fair Value:US$6087.9% undervalued
8 followersusers have followed this narrative
1 commentusers have commented on this narrative
8 likesusers have liked this narrative
TI


TickerTickle on Oracle ·
The Quiet Giant That Became AI’s Power Grid
Fair Value:US$389.8143.2% undervalued
21 followersusers have followed this narrative
1 commentusers have commented on this narrative
5 likesusers have liked this narrative
Recently Updated Narratives
NO

Norms70 on Standard Lithium ·
SLI is share to watch next 5 years
Fair Value:€4.57.6% undervalued
2 followersusers have followed this narrative
0 commentsusers have commented on this narrative
0 likesusers have liked this narrative
DA


davidlsander on Beam Therapeutics ·
The "Molecular Pencil": Why Beam's Technology is Built to Win
Fair Value:US$15082.3% undervalued
61 followersusers have followed this narrative
3 commentsusers have commented on this narrative
0 likesusers have liked this narrative
RE

RedhawkCC on Prime Medicine ·
PRME remains a long shot but publication in the New England Journal of Medicine helps.
Fair Value:US$0.0469.1k% overvalued
1 followerusers have followed this narrative
0 commentsusers have commented on this narrative
0 likesusers have liked this narrative
Popular Narratives
TH


TheWallstreetKing on MicroVision ·
MicroVision will explode future revenue by 380.37% with a vision towards success
Fair Value:US$6098.5% undervalued
118 followersusers have followed this narrative
11 commentsusers have commented on this narrative
22 likesusers have liked this narrative
AN


AnalystConsensusTarget on NVIDIA ·
NVDA: Expanding AI Demand Will Drive Major Data Center Investments Through 2026
Fair Value:US$250.3926.1% undervalued
962 followersusers have followed this narrative
6 commentsusers have commented on this narrative
25 likesusers have liked this narrative
RO


RockeTeller on Santacruz Silver Mining ·
Crazy Undervalued 42 Baggers Silver Play (Active & Running Mine)
Fair Value:CA$8696.4% undervalued
75 followersusers have followed this narrative
7 commentsusers have commented on this narrative
21 likesusers have liked this narrative
