
Advertisement
- United States
- /
- Hospitality
- /
- NasdaqGS:PLYA
Estimating The Intrinsic Value Of Playa Hotels & Resorts N.V. (NASDAQ:PLYA)

Key Insights
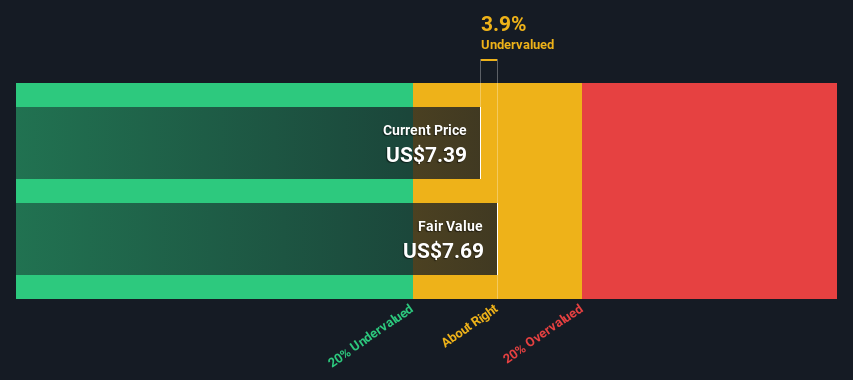
- The projected fair value for Playa Hotels & Resorts is US$7.69 based on 2 Stage Free Cash Flow to Equity
- With US$7.39 share price, Playa Hotels & Resorts appears to be trading close to its estimated fair value
- The US$12.83 analyst price target for PLYA is 67% more than our estimate of fair value
In this article we are going to estimate the intrinsic value of Playa Hotels & Resorts N.V. (NASDAQ:PLYA) by taking the forecast future cash flows of the company and discounting them back to today's value. We will take advantage of the Discounted Cash Flow (DCF) model for this purpose. It may sound complicated, but actually it is quite simple!
Companies can be valued in a lot of ways, so we would point out that a DCF is not perfect for every situation. Anyone interested in learning a bit more about intrinsic value should have a read of the Simply Wall St analysis model.
Check out our latest analysis for Playa Hotels & Resorts
What's The Estimated Valuation?
We're using the 2-stage growth model, which simply means we take in account two stages of company's growth. In the initial period the company may have a higher growth rate and the second stage is usually assumed to have a stable growth rate. To begin with, we have to get estimates of the next ten years of cash flows. Seeing as no analyst estimates of free cash flow are available to us, we have extrapolate the previous free cash flow (FCF) from the company's last reported value. We assume companies with shrinking free cash flow will slow their rate of shrinkage, and that companies with growing free cash flow will see their growth rate slow, over this period. We do this to reflect that growth tends to slow more in the early years than it does in later years.
Generally we assume that a dollar today is more valuable than a dollar in the future, so we need to discount the sum of these future cash flows to arrive at a present value estimate:
10-year free cash flow (FCF) estimate
| 2024 | 2025 | 2026 | 2027 | 2028 | 2029 | 2030 | 2031 | 2032 | 2033 | |
| Levered FCF ($, Millions) | US$117.9m | US$116.9m | US$116.9m | US$117.7m | US$119.0m | US$120.7m | US$122.6m | US$124.8m | US$127.1m | US$129.6m |
| Growth Rate Estimate Source | Est @ -2.09% | Est @ -0.83% | Est @ 0.05% | Est @ 0.67% | Est @ 1.10% | Est @ 1.40% | Est @ 1.62% | Est @ 1.76% | Est @ 1.87% | Est @ 1.94% |
| Present Value ($, Millions) Discounted @ 11% | US$106 | US$94.1 | US$84.4 | US$76.2 | US$69.1 | US$62.9 | US$57.3 | US$52.3 | US$47.8 | US$43.7 |
("Est" = FCF growth rate estimated by Simply Wall St)
Present Value of 10-year Cash Flow (PVCF) = US$694m
After calculating the present value of future cash flows in the initial 10-year period, we need to calculate the Terminal Value, which accounts for all future cash flows beyond the first stage. For a number of reasons a very conservative growth rate is used that cannot exceed that of a country's GDP growth. In this case we have used the 5-year average of the 10-year government bond yield (2.1%) to estimate future growth. In the same way as with the 10-year 'growth' period, we discount future cash flows to today's value, using a cost of equity of 11%.
Terminal Value (TV)= FCF2033 × (1 + g) ÷ (r – g) = US$130m× (1 + 2.1%) ÷ (11%– 2.1%) = US$1.4b
Present Value of Terminal Value (PVTV)= TV / (1 + r)10= US$1.4b÷ ( 1 + 11%)10= US$477m
The total value, or equity value, is then the sum of the present value of the future cash flows, which in this case is US$1.2b. The last step is to then divide the equity value by the number of shares outstanding. Compared to the current share price of US$7.4, the company appears about fair value at a 3.9% discount to where the stock price trades currently. Valuations are imprecise instruments though, rather like a telescope - move a few degrees and end up in a different galaxy. Do keep this in mind.
The Assumptions
The calculation above is very dependent on two assumptions. The first is the discount rate and the other is the cash flows. You don't have to agree with these inputs, I recommend redoing the calculations yourself and playing with them. The DCF also does not consider the possible cyclicality of an industry, or a company's future capital requirements, so it does not give a full picture of a company's potential performance. Given that we are looking at Playa Hotels & Resorts as potential shareholders, the cost of equity is used as the discount rate, rather than the cost of capital (or weighted average cost of capital, WACC) which accounts for debt. In this calculation we've used 11%, which is based on a levered beta of 1.576. Beta is a measure of a stock's volatility, compared to the market as a whole. We get our beta from the industry average beta of globally comparable companies, with an imposed limit between 0.8 and 2.0, which is a reasonable range for a stable business.
SWOT Analysis for Playa Hotels & Resorts
Strength
- Earnings growth over the past year exceeded the industry.
Weakness
- Interest payments on debt are not well covered.
Opportunity
- Annual earnings are forecast to grow faster than the American market.
- Good value based on P/E ratio and estimated fair value.
Threat
- Debt is not well covered by operating cash flow.
- Annual revenue is forecast to grow slower than the American market.
Next Steps:
Valuation is only one side of the coin in terms of building your investment thesis, and it ideally won't be the sole piece of analysis you scrutinize for a company. DCF models are not the be-all and end-all of investment valuation. Rather it should be seen as a guide to "what assumptions need to be true for this stock to be under/overvalued?" If a company grows at a different rate, or if its cost of equity or risk free rate changes sharply, the output can look very different. For Playa Hotels & Resorts, we've put together three additional aspects you should look at:
- Risks: Every company has them, and we've spotted 2 warning signs for Playa Hotels & Resorts (of which 1 doesn't sit too well with us!) you should know about.
- Management:Have insiders been ramping up their shares to take advantage of the market's sentiment for PLYA's future outlook? Check out our management and board analysis with insights on CEO compensation and governance factors.
- Other High Quality Alternatives: Do you like a good all-rounder? Explore our interactive list of high quality stocks to get an idea of what else is out there you may be missing!
PS. Simply Wall St updates its DCF calculation for every American stock every day, so if you want to find the intrinsic value of any other stock just search here.
New: Manage All Your Stock Portfolios in One Place
We've created the ultimate portfolio companion for stock investors, and it's free.
• Connect an unlimited number of Portfolios and see your total in one currency
• Be alerted to new Warning Signs or Risks via email or mobile
• Track the Fair Value of your stocks
Have feedback on this article? Concerned about the content? Get in touch with us directly. Alternatively, email editorial-team (at) simplywallst.com.
This article by Simply Wall St is general in nature. We provide commentary based on historical data and analyst forecasts only using an unbiased methodology and our articles are not intended to be financial advice. It does not constitute a recommendation to buy or sell any stock, and does not take account of your objectives, or your financial situation. We aim to bring you long-term focused analysis driven by fundamental data. Note that our analysis may not factor in the latest price-sensitive company announcements or qualitative material. Simply Wall St has no position in any stocks mentioned.
About NasdaqGS:PLYA
Playa Hotels & Resorts
Through its subsidiaries, owns, develops, and operates resorts in prime beachfront locations in Mexico and the Caribbean.
Acceptable track record and slightly overvalued.
Similar Companies
Market Insights

Advertisement
Community Narratives

BMW cruising ahead with new EVs and premium models to boost revenue 5%
Fair Value €135.07|44.6% undervalued
UN
Community Contributor
EU#2 - From Humble Beginnings to Global Powerhouse
Fair Value DKK 851.04|46.4% undervalued
TO
Community Contributor