
Advertisement
- United States
- /
- Hospitality
- /
- NasdaqCM:BTBD
BT Brands, Inc.'s (NASDAQ:BTBD) Shares Leap 29% Yet They're Still Not Telling The Full Story

BT Brands, Inc. (NASDAQ:BTBD) shareholders are no doubt pleased to see that the share price has bounced 29% in the last month, although it is still struggling to make up recently lost ground. Longer-term shareholders would be thankful for the recovery in the share price since it's now virtually flat for the year after the recent bounce.
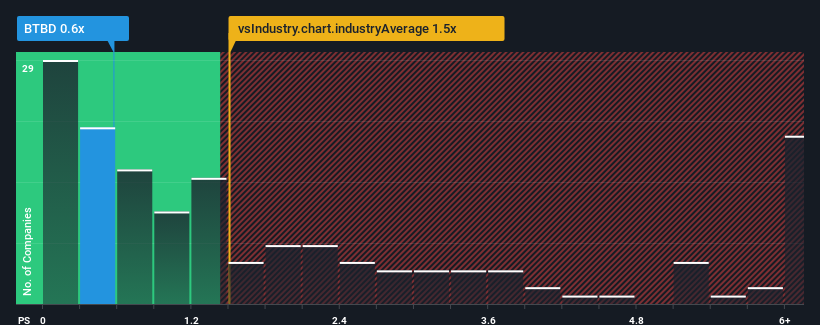
In spite of the firm bounce in price, BT Brands may still be sending bullish signals at the moment with its price-to-sales (or "P/S") ratio of 0.6x, since almost half of all companies in the Hospitality industry in the United States have P/S ratios greater than 1.5x and even P/S higher than 4x are not unusual. Nonetheless, we'd need to dig a little deeper to determine if there is a rational basis for the reduced P/S.
Check out our latest analysis for BT Brands
How Has BT Brands Performed Recently?
The recent revenue growth at BT Brands would have to be considered satisfactory if not spectacular. One possibility is that the P/S ratio is low because investors think this good revenue growth might actually underperform the broader industry in the near future. Those who are bullish on BT Brands will be hoping that this isn't the case, so that they can pick up the stock at a lower valuation.
Want the full picture on earnings, revenue and cash flow for the company? Then our free report on BT Brands will help you shine a light on its historical performance.Is There Any Revenue Growth Forecasted For BT Brands?
There's an inherent assumption that a company should underperform the industry for P/S ratios like BT Brands' to be considered reasonable.
If we review the last year of revenue growth, the company posted a worthy increase of 4.7%. This was backed up an excellent period prior to see revenue up by 73% in total over the last three years. So we can start by confirming that the company has done a great job of growing revenues over that time.
Comparing that recent medium-term revenue trajectory with the industry's one-year growth forecast of 15% shows it's noticeably more attractive.
With this information, we find it odd that BT Brands is trading at a P/S lower than the industry. Apparently some shareholders believe the recent performance has exceeded its limits and have been accepting significantly lower selling prices.
What Does BT Brands' P/S Mean For Investors?
BT Brands' stock price has surged recently, but its but its P/S still remains modest. We'd say the price-to-sales ratio's power isn't primarily as a valuation instrument but rather to gauge current investor sentiment and future expectations.
Our examination of BT Brands revealed its three-year revenue trends aren't boosting its P/S anywhere near as much as we would have predicted, given they look better than current industry expectations. When we see robust revenue growth that outpaces the industry, we presume that there are notable underlying risks to the company's future performance, which is exerting downward pressure on the P/S ratio. While recent revenue trends over the past medium-term suggest that the risk of a price decline is low, investors appear to perceive a likelihood of revenue fluctuations in the future.
There are also other vital risk factors to consider and we've discovered 3 warning signs for BT Brands (2 make us uncomfortable!) that you should be aware of before investing here.
If strong companies turning a profit tickle your fancy, then you'll want to check out this free list of interesting companies that trade on a low P/E (but have proven they can grow earnings).
Valuation is complex, but we're here to simplify it.
Discover if BT Brands might be undervalued or overvalued with our detailed analysis, featuring fair value estimates, potential risks, dividends, insider trades, and its financial condition.
Access Free AnalysisHave feedback on this article? Concerned about the content? Get in touch with us directly. Alternatively, email editorial-team (at) simplywallst.com.
This article by Simply Wall St is general in nature. We provide commentary based on historical data and analyst forecasts only using an unbiased methodology and our articles are not intended to be financial advice. It does not constitute a recommendation to buy or sell any stock, and does not take account of your objectives, or your financial situation. We aim to bring you long-term focused analysis driven by fundamental data. Note that our analysis may not factor in the latest price-sensitive company announcements or qualitative material. Simply Wall St has no position in any stocks mentioned.
About NasdaqCM:BTBD
BT Brands
Owns and operates fast-food restaurants in the north central region of United States.
Flawless balance sheet low.
Similar Companies
Market Insights

Advertisement
Community Narratives
Scaling up in building materials with smart M&A and growing profitability
Fair Value US$2.77|29.6% undervalued
CM
Community Contributor
Hims: The Platform Powering Personalised Healthcare
Fair Value US$114.01|49.1% undervalued
BL
Community Contributor
Undervalued lottery company with strong fundamentals
Fair Value AU$15.00|35.4% undervalued
RO
Community Contributor
Proximus, transferring money from the impatient to the patient investor
Fair Value €16.62|55.2% undervalued
AX
Community Contributor