- United States
- /
- Consumer Services
- /
- NasdaqGM:AACG
ATA Creativity Global (NASDAQ:AACG) Stock's 27% Dive Might Signal An Opportunity But It Requires Some Scrutiny


Unfortunately for some shareholders, the ATA Creativity Global (NASDAQ:AACG) share price has dived 27% in the last thirty days, prolonging recent pain. For any long-term shareholders, the last month ends a year to forget by locking in a 54% share price decline.
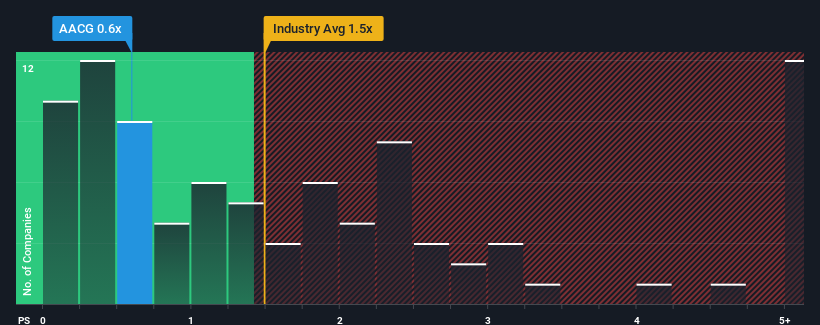
Since its price has dipped substantially, given about half the companies operating in the United States' Consumer Services industry have price-to-sales ratios (or "P/S") above 1.5x, you may consider ATA Creativity Global as an attractive investment with its 0.6x P/S ratio. Nonetheless, we'd need to dig a little deeper to determine if there is a rational basis for the reduced P/S.
View our latest analysis for ATA Creativity Global
What Does ATA Creativity Global's Recent Performance Look Like?
Revenue has risen firmly for ATA Creativity Global recently, which is pleasing to see. It might be that many expect the respectable revenue performance to degrade substantially, which has repressed the P/S. If that doesn't eventuate, then existing shareholders have reason to be optimistic about the future direction of the share price.
Although there are no analyst estimates available for ATA Creativity Global, take a look at this free data-rich visualisation to see how the company stacks up on earnings, revenue and cash flow.Is There Any Revenue Growth Forecasted For ATA Creativity Global?
The only time you'd be truly comfortable seeing a P/S as low as ATA Creativity Global's is when the company's growth is on track to lag the industry.
If we review the last year of revenue growth, the company posted a worthy increase of 9.9%. The latest three year period has also seen an excellent 36% overall rise in revenue, aided somewhat by its short-term performance. So we can start by confirming that the company has done a great job of growing revenues over that time.
Weighing that recent medium-term revenue trajectory against the broader industry's one-year forecast for expansion of 13% shows it's about the same on an annualised basis.
With this in consideration, we find it intriguing that ATA Creativity Global's P/S falls short of its industry peers. Apparently some shareholders are more bearish than recent times would indicate and have been accepting lower selling prices.
The Key Takeaway
ATA Creativity Global's recently weak share price has pulled its P/S back below other Consumer Services companies. We'd say the price-to-sales ratio's power isn't primarily as a valuation instrument but rather to gauge current investor sentiment and future expectations.
Our examination of ATA Creativity Global revealed its three-year revenue trends looking similar to current industry expectations hasn't given the P/S the boost we expected, given that it's lower than the wider industry P/S, There could be some unobserved threats to revenue preventing the P/S ratio from matching the company's performance. It appears some are indeed anticipating revenue instability, because the persistence of these recent medium-term conditions should normally provide more support to the share price.
We don't want to rain on the parade too much, but we did also find 1 warning sign for ATA Creativity Global that you need to be mindful of.
If you're unsure about the strength of ATA Creativity Global's business, why not explore our interactive list of stocks with solid business fundamentals for some other companies you may have missed.
New: Manage All Your Stock Portfolios in One Place
We've created the ultimate portfolio companion for stock investors, and it's free.
• Connect an unlimited number of Portfolios and see your total in one currency
• Be alerted to new Warning Signs or Risks via email or mobile
• Track the Fair Value of your stocks
Have feedback on this article? Concerned about the content? Get in touch with us directly. Alternatively, email editorial-team (at) simplywallst.com.
This article by Simply Wall St is general in nature. We provide commentary based on historical data and analyst forecasts only using an unbiased methodology and our articles are not intended to be financial advice. It does not constitute a recommendation to buy or sell any stock, and does not take account of your objectives, or your financial situation. We aim to bring you long-term focused analysis driven by fundamental data. Note that our analysis may not factor in the latest price-sensitive company announcements or qualitative material. Simply Wall St has no position in any stocks mentioned.
Have feedback on this article? Concerned about the content? Get in touch with us directly. Alternatively, email editorial-team@simplywallst.com
About NasdaqGM:AACG
ATA Creativity Global
Provides educational services to individual students through its training center network in China and internationally.
Mediocre balance sheet and slightly overvalued.
Market Insights

Community Narratives

