- United States
- /
- Food and Staples Retail
- /
- NasdaqGS:GO
Is There An Opportunity With Grocery Outlet Holding Corp.'s (NASDAQ:GO) 48% Undervaluation?


Key Insights
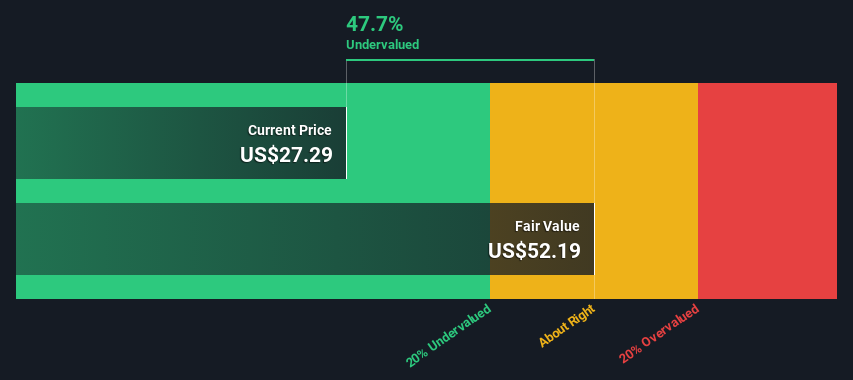
- Using the 2 Stage Free Cash Flow to Equity, Grocery Outlet Holding fair value estimate is US$52.19
- Grocery Outlet Holding's US$27.29 share price signals that it might be 48% undervalued
- Our fair value estimate is 44% higher than Grocery Outlet Holding's analyst price target of US$36.36
Today we'll do a simple run through of a valuation method used to estimate the attractiveness of Grocery Outlet Holding Corp. (NASDAQ:GO) as an investment opportunity by taking the expected future cash flows and discounting them to today's value. Our analysis will employ the Discounted Cash Flow (DCF) model. Models like these may appear beyond the comprehension of a lay person, but they're fairly easy to follow.
Remember though, that there are many ways to estimate a company's value, and a DCF is just one method. For those who are keen learners of equity analysis, the Simply Wall St analysis model here may be something of interest to you.
Check out our latest analysis for Grocery Outlet Holding
Is Grocery Outlet Holding Fairly Valued?
We use what is known as a 2-stage model, which simply means we have two different periods of growth rates for the company's cash flows. Generally the first stage is higher growth, and the second stage is a lower growth phase. To start off with, we need to estimate the next ten years of cash flows. Seeing as no analyst estimates of free cash flow are available to us, we have extrapolate the previous free cash flow (FCF) from the company's last reported value. We assume companies with shrinking free cash flow will slow their rate of shrinkage, and that companies with growing free cash flow will see their growth rate slow, over this period. We do this to reflect that growth tends to slow more in the early years than it does in later years.
A DCF is all about the idea that a dollar in the future is less valuable than a dollar today, and so the sum of these future cash flows is then discounted to today's value:
10-year free cash flow (FCF) forecast
| 2024 | 2025 | 2026 | 2027 | 2028 | 2029 | 2030 | 2031 | 2032 | 2033 | |
| Levered FCF ($, Millions) | US$126.2m | US$157.0m | US$184.8m | US$208.9m | US$229.4m | US$246.6m | US$261.1m | US$273.6m | US$284.5m | US$294.2m |
| Growth Rate Estimate Source | Est @ 33.96% | Est @ 24.42% | Est @ 17.74% | Est @ 13.06% | Est @ 9.79% | Est @ 7.50% | Est @ 5.89% | Est @ 4.77% | Est @ 3.98% | Est @ 3.43% |
| Present Value ($, Millions) Discounted @ 6.6% | US$118 | US$138 | US$153 | US$162 | US$167 | US$168 | US$167 | US$164 | US$160 | US$156 |
("Est" = FCF growth rate estimated by Simply Wall St)
Present Value of 10-year Cash Flow (PVCF) = US$1.6b
We now need to calculate the Terminal Value, which accounts for all the future cash flows after this ten year period. For a number of reasons a very conservative growth rate is used that cannot exceed that of a country's GDP growth. In this case we have used the 5-year average of the 10-year government bond yield (2.2%) to estimate future growth. In the same way as with the 10-year 'growth' period, we discount future cash flows to today's value, using a cost of equity of 6.6%.
Terminal Value (TV)= FCF2033 × (1 + g) ÷ (r – g) = US$294m× (1 + 2.2%) ÷ (6.6%– 2.2%) = US$6.8b
Present Value of Terminal Value (PVTV)= TV / (1 + r)10= US$6.8b÷ ( 1 + 6.6%)10= US$3.6b
The total value, or equity value, is then the sum of the present value of the future cash flows, which in this case is US$5.2b. In the final step we divide the equity value by the number of shares outstanding. Relative to the current share price of US$27.3, the company appears quite good value at a 48% discount to where the stock price trades currently. Valuations are imprecise instruments though, rather like a telescope - move a few degrees and end up in a different galaxy. Do keep this in mind.
Important Assumptions
The calculation above is very dependent on two assumptions. The first is the discount rate and the other is the cash flows. Part of investing is coming up with your own evaluation of a company's future performance, so try the calculation yourself and check your own assumptions. The DCF also does not consider the possible cyclicality of an industry, or a company's future capital requirements, so it does not give a full picture of a company's potential performance. Given that we are looking at Grocery Outlet Holding as potential shareholders, the cost of equity is used as the discount rate, rather than the cost of capital (or weighted average cost of capital, WACC) which accounts for debt. In this calculation we've used 6.6%, which is based on a levered beta of 0.884. Beta is a measure of a stock's volatility, compared to the market as a whole. We get our beta from the industry average beta of globally comparable companies, with an imposed limit between 0.8 and 2.0, which is a reasonable range for a stable business.
SWOT Analysis for Grocery Outlet Holding
- Earnings growth over the past year exceeded the industry.
- Debt is not viewed as a risk.
- No major weaknesses identified for GO.
- Annual revenue is forecast to grow faster than the American market.
- Trading below our estimate of fair value by more than 20%.
- Annual earnings are forecast to grow slower than the American market.
Next Steps:
Although the valuation of a company is important, it ideally won't be the sole piece of analysis you scrutinize for a company. The DCF model is not a perfect stock valuation tool. Instead the best use for a DCF model is to test certain assumptions and theories to see if they would lead to the company being undervalued or overvalued. For instance, if the terminal value growth rate is adjusted slightly, it can dramatically alter the overall result. Why is the intrinsic value higher than the current share price? For Grocery Outlet Holding, we've compiled three further elements you should further examine:
- Financial Health: Does GO have a healthy balance sheet? Take a look at our free balance sheet analysis with six simple checks on key factors like leverage and risk.
- Future Earnings: How does GO's growth rate compare to its peers and the wider market? Dig deeper into the analyst consensus number for the upcoming years by interacting with our free analyst growth expectation chart.
- Other High Quality Alternatives: Do you like a good all-rounder? Explore our interactive list of high quality stocks to get an idea of what else is out there you may be missing!
PS. Simply Wall St updates its DCF calculation for every American stock every day, so if you want to find the intrinsic value of any other stock just search here.
New: Manage All Your Stock Portfolios in One Place
We've created the ultimate portfolio companion for stock investors, and it's free.
• Connect an unlimited number of Portfolios and see your total in one currency
• Be alerted to new Warning Signs or Risks via email or mobile
• Track the Fair Value of your stocks
Have feedback on this article? Concerned about the content? Get in touch with us directly. Alternatively, email editorial-team (at) simplywallst.com.
This article by Simply Wall St is general in nature. We provide commentary based on historical data and analyst forecasts only using an unbiased methodology and our articles are not intended to be financial advice. It does not constitute a recommendation to buy or sell any stock, and does not take account of your objectives, or your financial situation. We aim to bring you long-term focused analysis driven by fundamental data. Note that our analysis may not factor in the latest price-sensitive company announcements or qualitative material. Simply Wall St has no position in any stocks mentioned.
About NasdaqGS:GO
Grocery Outlet Holding
Operates as a retailer of consumables and fresh products sold through independently operated stores in the United States.
Excellent balance sheet with limited growth.
Similar Companies
Market Insights

Community Narratives
