- United States
- /
- Luxury
- /
- NYSE:ONON
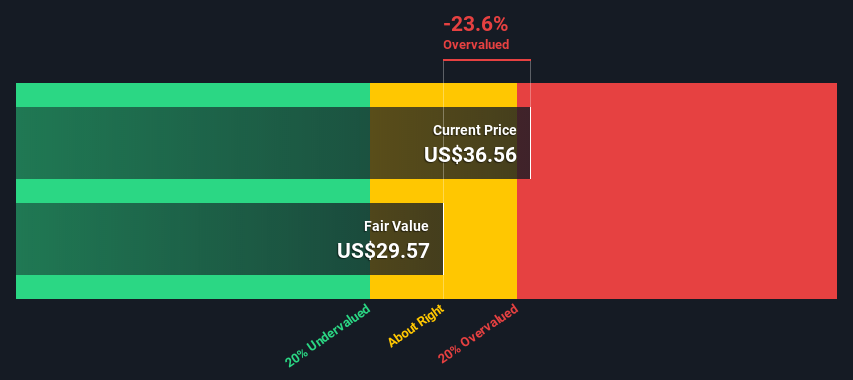
Is On Holding AG (NYSE:ONON) Worth US$36.6 Based On Its Intrinsic Value?


In this article we are going to estimate the intrinsic value of On Holding AG (NYSE:ONON) by taking the forecast future cash flows of the company and discounting them back to today's value. We will take advantage of the Discounted Cash Flow (DCF) model for this purpose. There's really not all that much to it, even though it might appear quite complex.
Companies can be valued in a lot of ways, so we would point out that a DCF is not perfect for every situation. If you want to learn more about discounted cash flow, the rationale behind this calculation can be read in detail in the Simply Wall St analysis model.
Check out our latest analysis for On Holding
The calculation
We're using the 2-stage growth model, which simply means we take in account two stages of company's growth. In the initial period the company may have a higher growth rate and the second stage is usually assumed to have a stable growth rate. To begin with, we have to get estimates of the next ten years of cash flows. Where possible we use analyst estimates, but when these aren't available we extrapolate the previous free cash flow (FCF) from the last estimate or reported value. We assume companies with shrinking free cash flow will slow their rate of shrinkage, and that companies with growing free cash flow will see their growth rate slow, over this period. We do this to reflect that growth tends to slow more in the early years than it does in later years.
Generally we assume that a dollar today is more valuable than a dollar in the future, and so the sum of these future cash flows is then discounted to today's value:
10-year free cash flow (FCF) forecast
| 2022 | 2023 | 2024 | 2025 | 2026 | 2027 | 2028 | 2029 | 2030 | 2031 | |
| Levered FCF (CHF, Millions) | -CHF7.33m | CHF67.6m | CHF123.5m | CHF195.9m | CHF277.4m | CHF359.8m | CHF436.8m | CHF504.7m | CHF562.6m | CHF611.2m |
| Growth Rate Estimate Source | Analyst x3 | Analyst x3 | Est @ 82.85% | Est @ 58.58% | Est @ 41.6% | Est @ 29.71% | Est @ 21.38% | Est @ 15.56% | Est @ 11.48% | Est @ 8.62% |
| Present Value (CHF, Millions) Discounted @ 6.6% | -CHF6.9 | CHF59.5 | CHF102 | CHF152 | CHF202 | CHF246 | CHF280 | CHF303 | CHF317 | CHF324 |
("Est" = FCF growth rate estimated by Simply Wall St)
Present Value of 10-year Cash Flow (PVCF) = CHF2.0b
The second stage is also known as Terminal Value, this is the business's cash flow after the first stage. For a number of reasons a very conservative growth rate is used that cannot exceed that of a country's GDP growth. In this case we have used the 5-year average of the 10-year government bond yield (2.0%) to estimate future growth. In the same way as with the 10-year 'growth' period, we discount future cash flows to today's value, using a cost of equity of 6.6%.
Terminal Value (TV)= FCF2031 × (1 + g) ÷ (r – g) = CHF611m× (1 + 2.0%) ÷ (6.6%– 2.0%) = CHF14b
Present Value of Terminal Value (PVTV)= TV / (1 + r)10= CHF14b÷ ( 1 + 6.6%)10= CHF7.2b
The total value is the sum of cash flows for the next ten years plus the discounted terminal value, which results in the Total Equity Value, which in this case is CHF9.1b. The last step is to then divide the equity value by the number of shares outstanding. Compared to the current share price of US$36.6, the company appears slightly overvalued at the time of writing. The assumptions in any calculation have a big impact on the valuation, so it is better to view this as a rough estimate, not precise down to the last cent.
The assumptions
We would point out that the most important inputs to a discounted cash flow are the discount rate and of course the actual cash flows. Part of investing is coming up with your own evaluation of a company's future performance, so try the calculation yourself and check your own assumptions. The DCF also does not consider the possible cyclicality of an industry, or a company's future capital requirements, so it does not give a full picture of a company's potential performance. Given that we are looking at On Holding as potential shareholders, the cost of equity is used as the discount rate, rather than the cost of capital (or weighted average cost of capital, WACC) which accounts for debt. In this calculation we've used 6.6%, which is based on a levered beta of 1.052. Beta is a measure of a stock's volatility, compared to the market as a whole. We get our beta from the industry average beta of globally comparable companies, with an imposed limit between 0.8 and 2.0, which is a reasonable range for a stable business.
Looking Ahead:
Whilst important, the DCF calculation shouldn't be the only metric you look at when researching a company. DCF models are not the be-all and end-all of investment valuation. Rather it should be seen as a guide to "what assumptions need to be true for this stock to be under/overvalued?" For instance, if the terminal value growth rate is adjusted slightly, it can dramatically alter the overall result. Can we work out why the company is trading at a premium to intrinsic value? For On Holding, we've put together three relevant items you should explore:
- Risks: For example, we've discovered 2 warning signs for On Holding (1 shouldn't be ignored!) that you should be aware of before investing here.
- Future Earnings: How does ONON's growth rate compare to its peers and the wider market? Dig deeper into the analyst consensus number for the upcoming years by interacting with our free analyst growth expectation chart.
- Other High Quality Alternatives: Do you like a good all-rounder? Explore our interactive list of high quality stocks to get an idea of what else is out there you may be missing!
PS. Simply Wall St updates its DCF calculation for every American stock every day, so if you want to find the intrinsic value of any other stock just search here.
New: AI Stock Screener & Alerts
Our new AI Stock Screener scans the market every day to uncover opportunities.
• Dividend Powerhouses (3%+ Yield)
• Undervalued Small Caps with Insider Buying
• High growth Tech and AI Companies
Or build your own from over 50 metrics.
Have feedback on this article? Concerned about the content? Get in touch with us directly. Alternatively, email editorial-team (at) simplywallst.com.
This article by Simply Wall St is general in nature. We provide commentary based on historical data and analyst forecasts only using an unbiased methodology and our articles are not intended to be financial advice. It does not constitute a recommendation to buy or sell any stock, and does not take account of your objectives, or your financial situation. We aim to bring you long-term focused analysis driven by fundamental data. Note that our analysis may not factor in the latest price-sensitive company announcements or qualitative material. Simply Wall St has no position in any stocks mentioned.
About NYSE:ONON
On Holding
Engages in the development and distribution of sports products worldwide.
Flawless balance sheet with solid track record.
Similar Companies
Market Insights

Community Narratives

