Advertisement
- United States
- /
- Luxury
- /
- NYSE:NKE
What Nike's Latest Job Cuts Mean For Its Share Price in 2025

Simply Wall St
Reviewed by Bailey Pemberton
Thinking about what to do with your NIKE shares can feel a bit like deciding whether to hang onto those classic sneakers or trade up for something new. The last week certainly gave investors reason to look twice, with NIKE’s stock jumping 7.7%. However, if you take a broader view, that increase seems less impressive, as the stock is up only 0.4% over the past month and a modest 1.2% year to date. For long-term holders, the numbers are a bit disheartening, with a 7.2% decline over the past year and an even steeper slide of 38.5% over the last five years.
What is behind this seesaw ride? Recent headlines indicate that NIKE is in the middle of some major changes. The company just announced plans to cut under 1% of corporate jobs as part of a broader business overhaul, and they have brought in a new Converse CEO to address ongoing sales challenges at that brand. Moves like these can signal both risk and reward, as the company works to spark growth after a stretch of underwhelming returns.
Is NIKE a bargain hiding in plain sight? Looking strictly at the numbers, the company is currently undervalued in exactly zero out of six value checks, resulting in a valuation score of 0. But what do those checks actually mean for you as an investor, and is there a smarter way to assess the stock’s true worth? Let’s dig into the details of each valuation approach and I will share my preferred method for evaluating the stock at the end.
NIKE scores just 0/6 on our valuation checks. See what other red flags we found in the full valuation breakdown.
Approach 1: NIKE Discounted Cash Flow (DCF) Analysis
A Discounted Cash Flow (DCF) model estimates what a company is worth today by projecting its future cash flows and then discounting those back to present value. In NIKE’s case, the model uses a two-stage Free Cash Flow to Equity approach, where future cash flows are estimated both by analyst forecasts and longer-term trend assumptions.
NIKE’s most recent reported Free Cash Flow is $3.01 Billion. Looking ahead, analysts have projected Free Cash Flows for the next five years, starting with $2.01 Billion in 2026 and climbing to $5.89 Billion by 2030. After that, the model continues with reasonable growth estimates provided by industry standards for another five years, culminating in $7.42 Billion projected by 2035. All cash flows are in US Dollars.
This exercise arrives at an estimated fair value for the stock of $62.82 per share. Comparing this intrinsic value to the current market price, the DCF analysis suggests NIKE stock is currently 18.7% overvalued.
Result: OVERVALUED
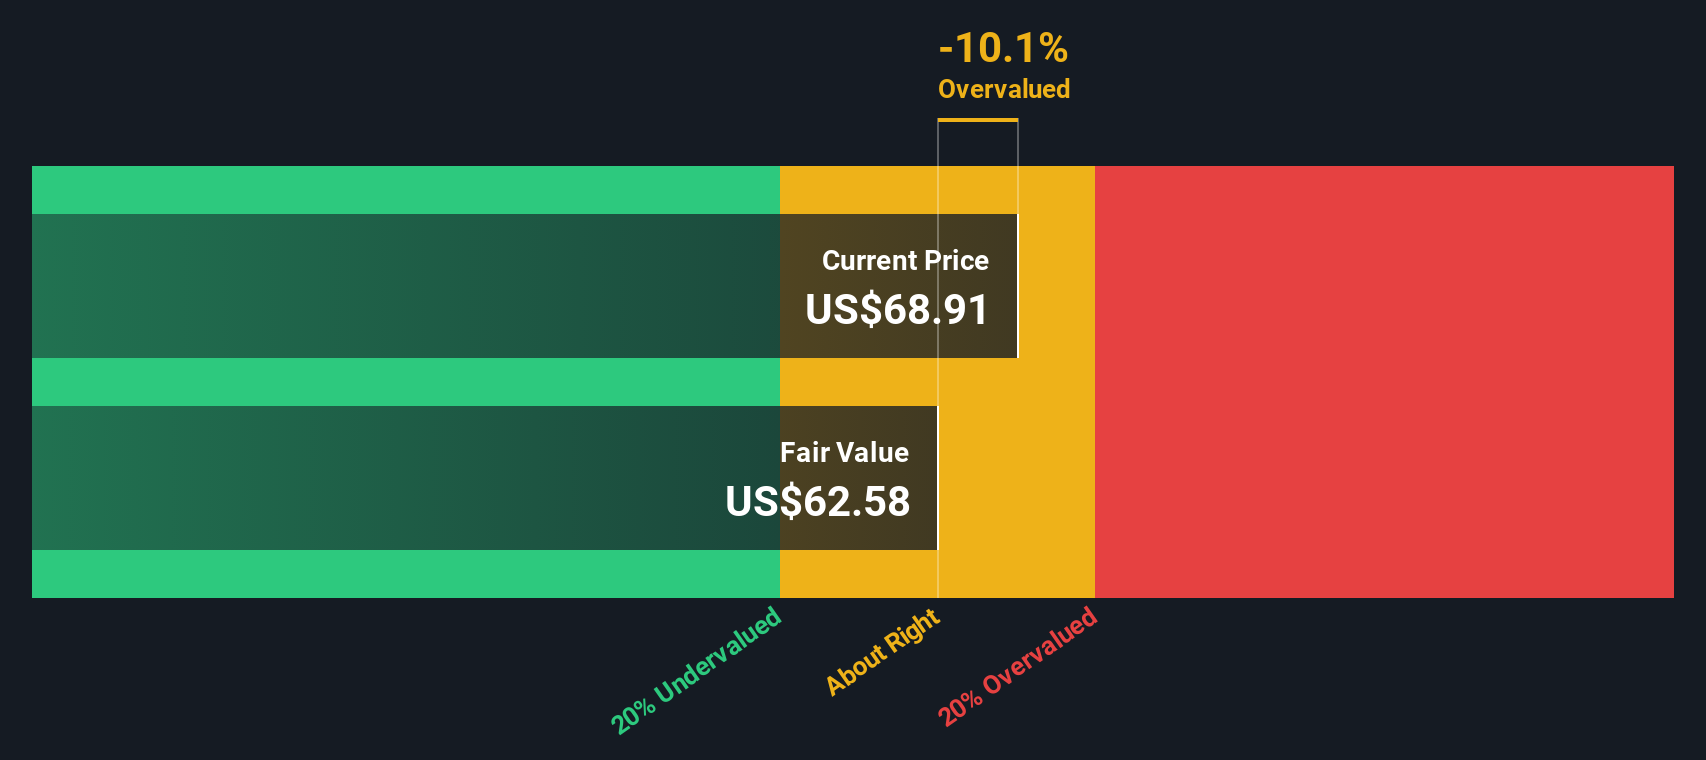
Our Discounted Cash Flow (DCF) analysis suggests NIKE may be overvalued by 18.7%. Find undervalued stocks or create your own screener to find better value opportunities.
Approach 2: NIKE Price vs Earnings (PE)
The Price-to-Earnings (PE) ratio is often the go-to valuation tool for profitable companies because it connects what investors are willing to pay with what the company actually earns. A company that reliably makes money, like NIKE, can be sensibly valued by seeing how its share price compares to its earnings. This gives investors a quick way to gauge whether the stock seems cheap or expensive relative to profits.
What counts as a “normal” or “fair” PE ratio depends on several factors, particularly growth expectations and risk. Faster-growing, lower-risk companies can usually support a higher PE while slower growers or those with more risk should command a lower multiple. So, a high PE might be justified if investors expect stellar growth, but could be a warning flag if growth is expected to slow.
NIKE currently trades at a PE ratio of 38x, which is higher than both the average for its global peers (35.08x) and its industry average (21.49x). At a glance, that suggests NIKE is priced above its peers. Instead of just comparing with broad benchmarks, we use Simply Wall St’s proprietary “Fair Ratio,” which weighs NIKE’s own earnings growth, industry conditions, profit margins, company size and risks, to get a more complete picture. For NIKE, the Fair Ratio is 27.44x, indicating the company’s fundamentals support a lower PE than the current market price assumes. This tailored approach helps avoid the pitfalls of generic industry or peer comparisons and offers a sharper lens for investors.
Comparing NIKE’s actual PE of 38x to its Fair Ratio of 27.44x suggests the stock is currently overvalued by this measure.
Result: OVERVALUED

PE ratios tell one story, but what if the real opportunity lies elsewhere? Discover companies where insiders are betting big on explosive growth.
Upgrade Your Decision Making: Choose your NIKE Narrative
Earlier, we mentioned that there’s an even better way to understand valuation, so let’s introduce you to Narratives. A Narrative is simply the story behind the numbers, your own perspective on a company’s fair value, based on your expectations for its future revenue, earnings, and profit margins.
Think of Narratives as a bridge that connects a company’s business momentum or challenges to a financial forecast, and then directly to an updated fair value. Instead of relying on generic models or static ratios, Narratives let you express what you believe will actually happen for NIKE and see the real implications.
On Simply Wall St’s platform, Narratives are available right now on the Community page. Millions of investors use them because they’re easy to build, update, and compare, so you can quickly see if NIKE’s current share price is above or below your own estimate of fair value, making buy or sell decisions far more concrete.
Importantly, Narratives don’t stand still. Anytime fresh news hits, such as a new CEO, earnings release or major industry shift, your Narrative and its fair value update automatically to stay relevant.
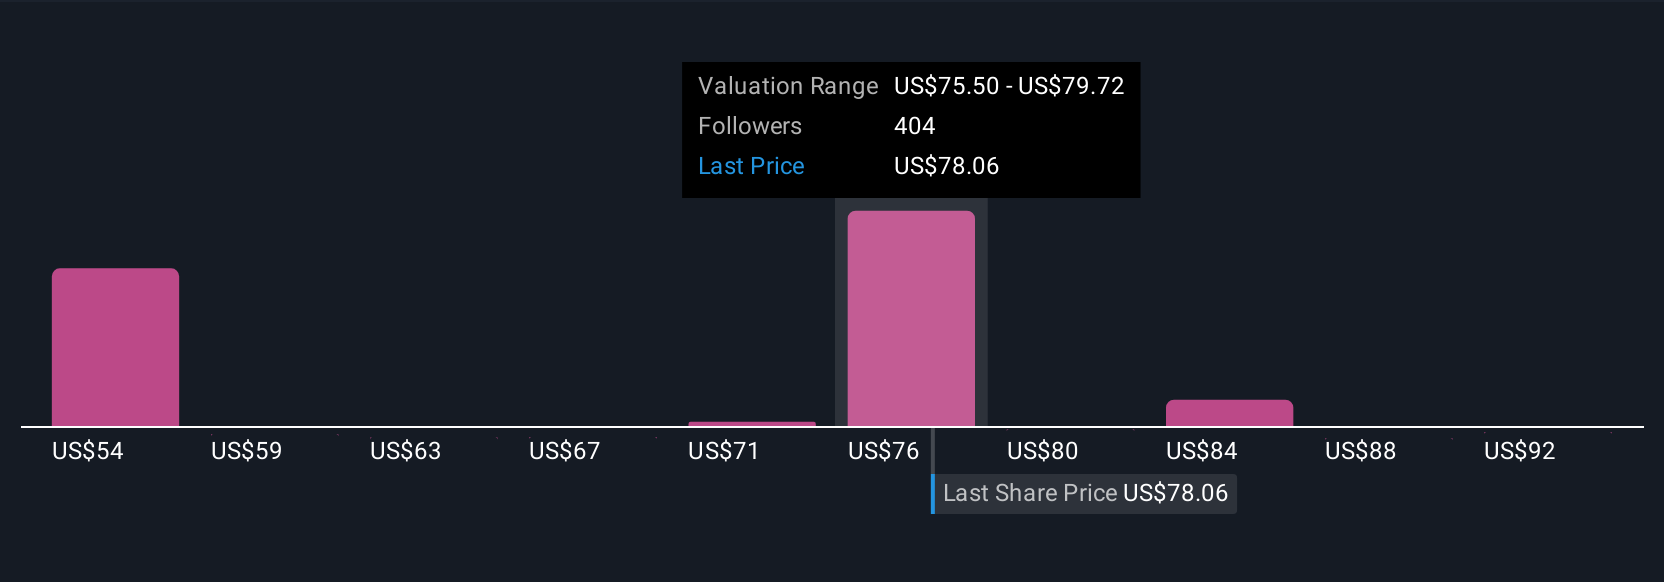
For example, some investors currently have a $38 per share fair value view for NIKE, while others estimate over $120, showing just how unique Narratives can capture optimism, caution, or anything in between.
Do you think there's more to the story for NIKE? Create your own Narrative to let the Community know!
This article by Simply Wall St is general in nature. We provide commentary based on historical data and analyst forecasts only using an unbiased methodology and our articles are not intended to be financial advice. It does not constitute a recommendation to buy or sell any stock, and does not take account of your objectives, or your financial situation. We aim to bring you long-term focused analysis driven by fundamental data. Note that our analysis may not factor in the latest price-sensitive company announcements or qualitative material. Simply Wall St has no position in any stocks mentioned.
Valuation is complex, but we're here to simplify it.
Discover if NIKE might be undervalued or overvalued with our detailed analysis, featuring fair value estimates, potential risks, dividends, insider trades, and its financial condition.
Access Free AnalysisHave feedback on this article? Concerned about the content? Get in touch with us directly. Alternatively, email editorial-team@simplywallst.com
About NYSE:NKE
NIKE
Designs, develops, markets, and sells athletic and casual footwear, apparel, equipment, accessories, and services for men, women, and kids in North America, Europe, the Middle East, Africa, Greater China, the Asia Pacific, and Latin America.
Flawless balance sheet established dividend payer.
Similar Companies
Market Insights

Advertisement
Weekly Picks
RO


RockeTeller on Santacruz Silver Mining ·
Crazy Undervalued 42 Baggers Silver Play (Active & Running Mine)
Fair Value:CA$8696.4% undervalued
39 followersusers have followed this narrative
6 commentsusers have commented on this narrative
10 likesusers have liked this narrative
RO


Robbo on Fiducian Group ·
Fiducian: Compliance Clouds or Value Opportunity?
Fair Value:AU$123.8% undervalued
4 followersusers have followed this narrative
0 commentsusers have commented on this narrative
0 likesusers have liked this narrative
WO

woodworthfund on Willamette Valley Vineyards ·
Willamette Valley Vineyards (WVVI): Not-So-Great Value
Fair Value:US$244.5% overvalued
6 followersusers have followed this narrative
0 commentsusers have commented on this narrative
1 likeusers have liked this narrative
Recently Updated Narratives
FU

FundamentallySarcastic on Credit Corp Group ·
Moderation and Stabilisation: HOLD: Fair Price based on a 4-year Cycle is $12.08
Fair Value:AU$12.6411.8% overvalued
2 followersusers have followed this narrative
0 commentsusers have commented on this narrative
0 likesusers have liked this narrative
MA


MarkoVT on Alphabet ·
Positioned globally, partnered locally
Fair Value:US$390.1918.1% undervalued
3 followersusers have followed this narrative
0 commentsusers have commented on this narrative
0 likesusers have liked this narrative
JO


JohnJ on Worldline ·
When will fraudsters be investigated in depth. Fraud was ongoing in France too.
Fair Value:€0.5190.0% overvalued
2 followersusers have followed this narrative
0 commentsusers have commented on this narrative
0 likesusers have liked this narrative
Popular Narratives
TH


TheWallstreetKing on MicroVision ·
MicroVision will explode future revenue by 380.37% with a vision towards success
Fair Value:US$6098.5% undervalued
114 followersusers have followed this narrative
11 commentsusers have commented on this narrative
22 likesusers have liked this narrative
AN


AnalystConsensusTarget on NVIDIA ·
NVDA: Expanding AI Demand Will Drive Major Data Center Investments Through 2026
Fair Value:US$250.3928.3% undervalued
952 followersusers have followed this narrative
6 commentsusers have commented on this narrative
25 likesusers have liked this narrative
OS

oscargarcia on Alphabet ·
The company that turned a verb into a global necessity and basically runs the modern internet, digital ads, smartphones, maps, and AI.
Fair Value:US$3406.0% undervalued
147 followersusers have followed this narrative
6 commentsusers have commented on this narrative
18 likesusers have liked this narrative

