Advertisement
- United States
- /
- Consumer Durables
- /
- NYSE:LEN
Does Lennar’s Recent Slide Signal a Rebound Opportunity in 2025?

Simply Wall St
Reviewed by Bailey Pemberton
If you are staring at Lennar stock right now, wondering whether to buy, sell, or hold, you are not alone. With the share price recently closing at $122.14, Lennar has had a rocky stretch. Over just the last week, the stock dipped by 3.1%. Extend the time horizon and you will notice a 13.9% drop in the past month, and since the start of the year, the stock is down 9.1%. That may sound rough, but zoom out even further and Lennar has actually delivered a 76.7% gain over three years and 70.9% across the last five.
These swings are not happening in a vacuum. Lennar, like other homebuilders, faces a market shaped by fluctuating mortgage rates and changing consumer demand in the housing sector. When the housing market looks chilly, risk perceptions around companies like Lennar rise, pushing stock prices down. With long-term demographic trends supporting housing demand, some investors are watching for a rebound opportunity.
Here is where it gets interesting. When we look at Lennar’s valuation score, it is just a 1 out of 6 based on common undervaluation tests. On paper, that hints Lennar might not be particularly cheap at these levels, at least by most traditional measures. However, valuation is not always as straightforward as it seems. Let us break down how Lennar stacks up across different valuation approaches, and then dig into what might be an even sharper way to understand what the market is really paying for right now.
Lennar scores just 1/6 on our valuation checks. See what other red flags we found in the full valuation breakdown.
Approach 1: Lennar Discounted Cash Flow (DCF) Analysis
The Discounted Cash Flow (DCF) model works by projecting a company’s future cash flows and discounting them to today’s dollars, providing an estimate of what the business may truly be worth. For Lennar, recent figures show the company posted a negative free cash flow over the last twelve months, about -$702.5 million. However, analysts expect a significant turnaround, with future projections reaching $2.15 billion in free cash flow by 2026.
Further into the future, Simply Wall St extrapolates these estimates, with annual free cash flows remaining above the $1.3 billion mark through 2035. This growth trajectory, based on the “2 Stage Free Cash Flow to Equity” model, forms the backbone of the DCF calculation for Lennar.
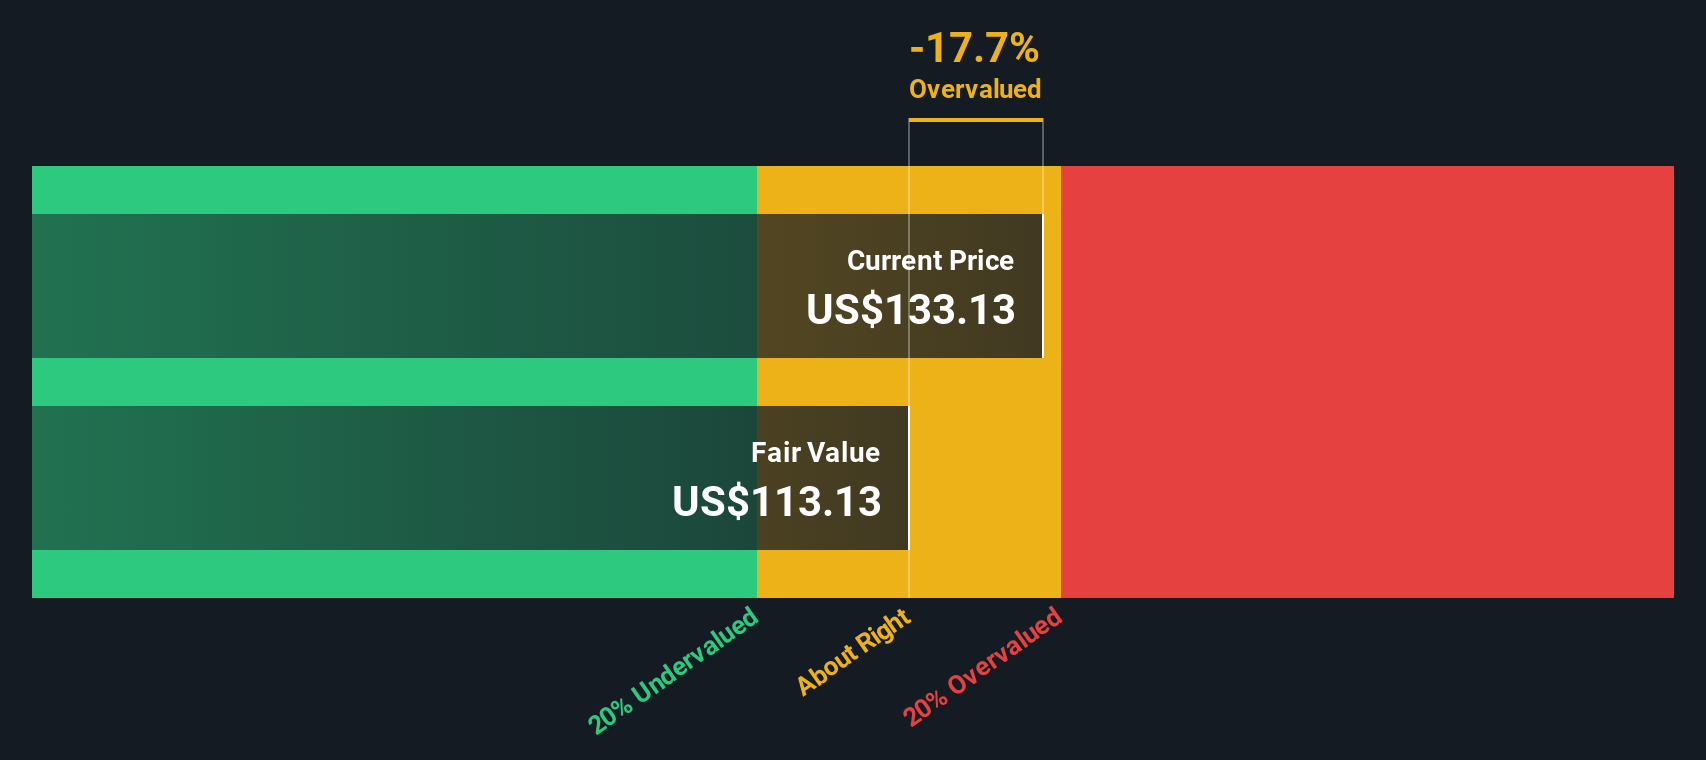
After discounting all of these projected cash flows back to their present value, the estimated intrinsic value for Lennar comes out to $81.63 per share. With shares recently closing at $122.14, this analysis points toward Lennar being about 49.6% overvalued according to the DCF approach.
Result: OVERVALUED
Our Discounted Cash Flow (DCF) analysis suggests Lennar may be overvalued by 49.6%. Find undervalued stocks or create your own screener to find better value opportunities.
Approach 2: Lennar Price vs Earnings
For profitable companies like Lennar, the price-to-earnings (PE) ratio is often the preferred valuation multiple. It allows investors to gauge how much they are paying for each dollar of a company’s earnings. A company’s PE should generally be higher if investors expect above-average growth or believe the business carries lower risk, while weaker growth prospects or higher risks tend to lower the “fair” PE ratio.
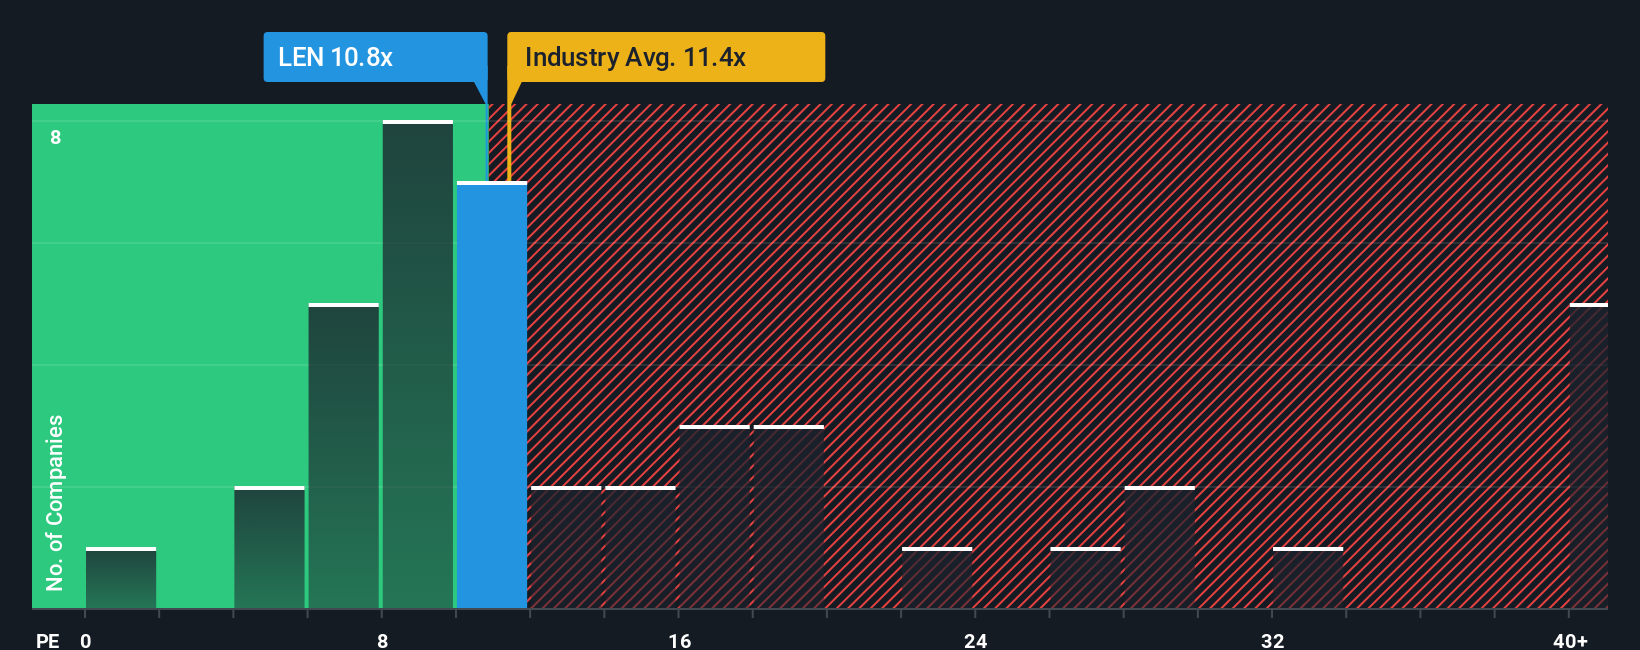
Lennar currently trades at an 11.7x PE ratio. This compares closely with its peer average of 11.4x as well as the wider Consumer Durables industry average at 11.1x. On the surface, Lennar’s valuation looks right in line with its competitors.
Simply Wall St, however, calculates a “Fair Ratio” that provides an even more nuanced view. This Fair Ratio, 16.99x for Lennar, accounts for factors such as the company’s expected earnings growth, profit margins, risk profile, industry position, and market capitalization. Unlike simple peer or industry comparisons, this proprietary metric should better reflect the unique situation and outlook for Lennar.
Taking this all together, Lennar’s current PE of 11.7x is well below the Fair Ratio of 17x. This suggests the market may be underestimating the company’s future potential.
Result: UNDERVALUED
PE ratios tell one story, but what if the real opportunity lies elsewhere? Discover companies where insiders are betting big on explosive growth.
Upgrade Your Decision Making: Choose your Lennar Narrative
Earlier we mentioned there is an even better way to understand valuation. Let us introduce you to Narratives. A Narrative is simply your story for a company; it combines your perspective on how Lennar will perform, the numbers you forecast for its revenue, earnings and profit margins, and the price you believe the company is truly worth.
Narratives allow you to connect a company's outlook to a concrete financial forecast and fair value, turning personal research and expectations into actionable investment decisions. On Simply Wall St’s Community page, you can easily set up your own Narrative or explore those shared by others, benefiting from a tool used by millions of investors worldwide.
By laying out your Narrative, you can compare the Fair Value you calculate to the current price. This makes it much clearer whether you think it is time to buy, hold, or sell. The best part is that Narratives update in real time as new events or earnings reports come in, keeping your view relevant and informed.
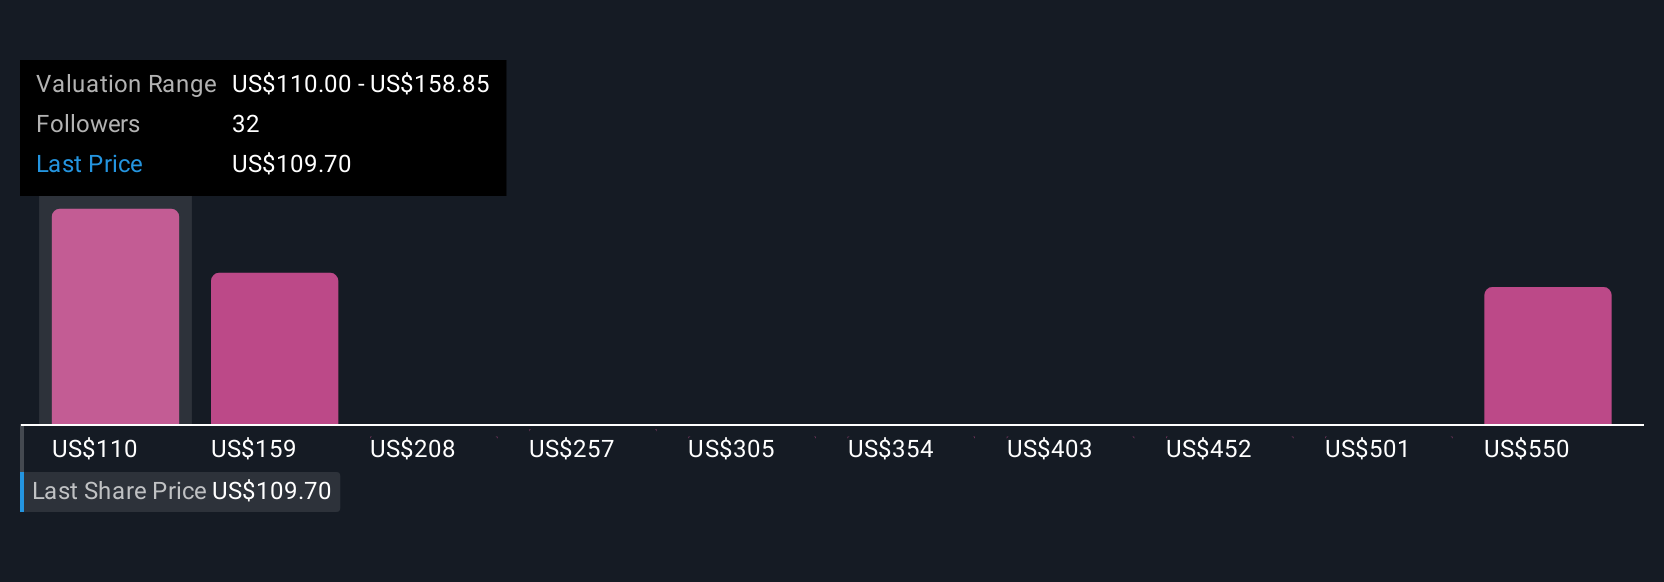
For example, on Lennar, the most bullish investors set their fair value at $215 per share, seeing strong long-term growth and margin recovery. The most bearish see just $95 per share as fair value due to persistent margin pressure and macro risks.
Do you think there's more to the story for Lennar? Create your own Narrative to let the Community know!
This article by Simply Wall St is general in nature. We provide commentary based on historical data and analyst forecasts only using an unbiased methodology and our articles are not intended to be financial advice. It does not constitute a recommendation to buy or sell any stock, and does not take account of your objectives, or your financial situation. We aim to bring you long-term focused analysis driven by fundamental data. Note that our analysis may not factor in the latest price-sensitive company announcements or qualitative material. Simply Wall St has no position in any stocks mentioned.
New: AI Stock Screener & Alerts
Our new AI Stock Screener scans the market every day to uncover opportunities.
• Dividend Powerhouses (3%+ Yield)
• Undervalued Small Caps with Insider Buying
• High growth Tech and AI Companies
Or build your own from over 50 metrics.
Have feedback on this article? Concerned about the content? Get in touch with us directly. Alternatively, email editorial-team@simplywallst.com
About NYSE:LEN
Lennar
Operates as a homebuilder primarily under the Lennar brand in the United States.
Excellent balance sheet average dividend payer.
Similar Companies
Market Insights

Advertisement
Community Narratives
A formidable player in AI and enterprise computing.
Fair Value US$210.00|0.7% overvalued
CO
Community Contributor
IREN's Bold Moves in Sustainable Bitcoin Mining & AI Data Centers
Fair Value US$72.52|14.9% undervalued
BL
Community Contributor
Cooling the Champions: The Aussie Tech Behind F1's Victories
Fair Value AU$12.40|38.1% undervalued
TR
Community Contributor