- United States
- /
- Luxury
- /
- NYSE:AS
Amer Sports, Inc.'s (NYSE:AS) Intrinsic Value Is Potentially 17% Below Its Share Price


Key Insights
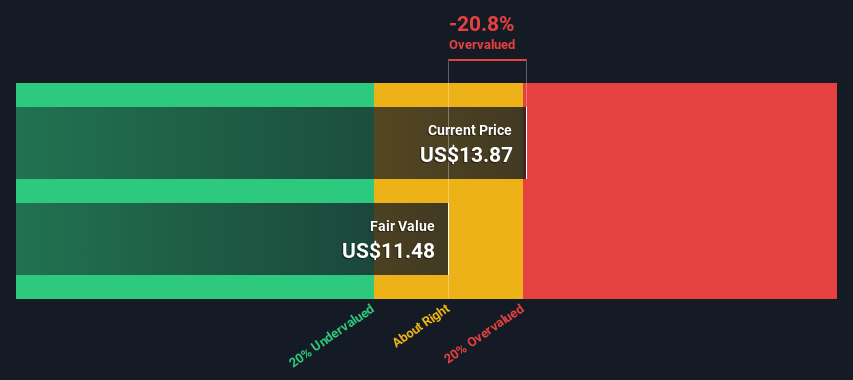
- Using the 2 Stage Free Cash Flow to Equity, Amer Sports fair value estimate is US$11.48
- Amer Sports' US$13.87 share price signals that it might be 21% overvalued
- Our fair value estimate is 40% lower than Amer Sports' analyst price target of US$19.29
Today we'll do a simple run through of a valuation method used to estimate the attractiveness of Amer Sports, Inc. (NYSE:AS) as an investment opportunity by projecting its future cash flows and then discounting them to today's value. The Discounted Cash Flow (DCF) model is the tool we will apply to do this. Believe it or not, it's not too difficult to follow, as you'll see from our example!
Remember though, that there are many ways to estimate a company's value, and a DCF is just one method. For those who are keen learners of equity analysis, the Simply Wall St analysis model here may be something of interest to you.
Check out our latest analysis for Amer Sports
The Calculation
We use what is known as a 2-stage model, which simply means we have two different periods of growth rates for the company's cash flows. Generally the first stage is higher growth, and the second stage is a lower growth phase. In the first stage we need to estimate the cash flows to the business over the next ten years. Where possible we use analyst estimates, but when these aren't available we extrapolate the previous free cash flow (FCF) from the last estimate or reported value. We assume companies with shrinking free cash flow will slow their rate of shrinkage, and that companies with growing free cash flow will see their growth rate slow, over this period. We do this to reflect that growth tends to slow more in the early years than it does in later years.
Generally we assume that a dollar today is more valuable than a dollar in the future, so we discount the value of these future cash flows to their estimated value in today's dollars:
10-year free cash flow (FCF) forecast
| 2024 | 2025 | 2026 | 2027 | 2028 | 2029 | 2030 | 2031 | 2032 | 2033 | |
| Levered FCF ($, Millions) | -US$750.0k | US$186.7m | US$264.5m | US$594.0m | US$626.0m | US$651.6m | US$674.9m | US$696.6m | US$717.2m | US$737.2m |
| Growth Rate Estimate Source | Analyst x4 | Analyst x5 | Analyst x2 | Analyst x1 | Analyst x1 | Est @ 4.09% | Est @ 3.57% | Est @ 3.22% | Est @ 2.96% | Est @ 2.79% |
| Present Value ($, Millions) Discounted @ 11% | -US$0.7 | US$152 | US$194 | US$393 | US$374 | US$351 | US$328 | US$305 | US$283 | US$262 |
("Est" = FCF growth rate estimated by Simply Wall St)
Present Value of 10-year Cash Flow (PVCF) = US$2.6b
After calculating the present value of future cash flows in the initial 10-year period, we need to calculate the Terminal Value, which accounts for all future cash flows beyond the first stage. The Gordon Growth formula is used to calculate Terminal Value at a future annual growth rate equal to the 5-year average of the 10-year government bond yield of 2.4%. We discount the terminal cash flows to today's value at a cost of equity of 11%.
Terminal Value (TV)= FCF2033 × (1 + g) ÷ (r – g) = US$737m× (1 + 2.4%) ÷ (11%– 2.4%) = US$8.9b
Present Value of Terminal Value (PVTV)= TV / (1 + r)10= US$8.9b÷ ( 1 + 11%)10= US$3.2b
The total value, or equity value, is then the sum of the present value of the future cash flows, which in this case is US$5.8b. To get the intrinsic value per share, we divide this by the total number of shares outstanding. Compared to the current share price of US$13.9, the company appears slightly overvalued at the time of writing. Remember though, that this is just an approximate valuation, and like any complex formula - garbage in, garbage out.
The Assumptions
We would point out that the most important inputs to a discounted cash flow are the discount rate and of course the actual cash flows. If you don't agree with these result, have a go at the calculation yourself and play with the assumptions. The DCF also does not consider the possible cyclicality of an industry, or a company's future capital requirements, so it does not give a full picture of a company's potential performance. Given that we are looking at Amer Sports as potential shareholders, the cost of equity is used as the discount rate, rather than the cost of capital (or weighted average cost of capital, WACC) which accounts for debt. In this calculation we've used 11%, which is based on a levered beta of 1.641. Beta is a measure of a stock's volatility, compared to the market as a whole. We get our beta from the industry average beta of globally comparable companies, with an imposed limit between 0.8 and 2.0, which is a reasonable range for a stable business.
SWOT Analysis for Amer Sports
- No major strengths identified for AS.
- Interest payments on debt are not well covered.
- Current share price is above our estimate of fair value.
- Expected to breakeven next year.
- Has sufficient cash runway for more than 3 years based on current free cash flows.
- Significant insider buying over the past 3 months.
- Debt is not well covered by operating cash flow.
- Total liabilities exceed total assets, which raises the risk of financial distress.
Next Steps:
Although the valuation of a company is important, it shouldn't be the only metric you look at when researching a company. It's not possible to obtain a foolproof valuation with a DCF model. Preferably you'd apply different cases and assumptions and see how they would impact the company's valuation. If a company grows at a different rate, or if its cost of equity or risk free rate changes sharply, the output can look very different. Why is the intrinsic value lower than the current share price? For Amer Sports, there are three essential items you should explore:
- Risks: We feel that you should assess the 1 warning sign for Amer Sports we've flagged before making an investment in the company.
- Future Earnings: How does AS's growth rate compare to its peers and the wider market? Dig deeper into the analyst consensus number for the upcoming years by interacting with our free analyst growth expectation chart.
- Other Solid Businesses: Low debt, high returns on equity and good past performance are fundamental to a strong business. Why not explore our interactive list of stocks with solid business fundamentals to see if there are other companies you may not have considered!
PS. Simply Wall St updates its DCF calculation for every American stock every day, so if you want to find the intrinsic value of any other stock just search here.
New: Manage All Your Stock Portfolios in One Place
We've created the ultimate portfolio companion for stock investors, and it's free.
• Connect an unlimited number of Portfolios and see your total in one currency
• Be alerted to new Warning Signs or Risks via email or mobile
• Track the Fair Value of your stocks
Have feedback on this article? Concerned about the content? Get in touch with us directly. Alternatively, email editorial-team (at) simplywallst.com.
This article by Simply Wall St is general in nature. We provide commentary based on historical data and analyst forecasts only using an unbiased methodology and our articles are not intended to be financial advice. It does not constitute a recommendation to buy or sell any stock, and does not take account of your objectives, or your financial situation. We aim to bring you long-term focused analysis driven by fundamental data. Note that our analysis may not factor in the latest price-sensitive company announcements or qualitative material. Simply Wall St has no position in any stocks mentioned.
About NYSE:AS
Amer Sports
Designs, manufactures, markets, distributes, and sells sports equipment, apparel, footwear, and accessories in Europe, the Middle East, Africa, the Americas, Mainland China, Hong Kong, Macau, Taiwan, and the Asia Pacific.
Reasonable growth potential with adequate balance sheet.
Similar Companies
Market Insights

Community Narratives

