Stock Analysis
- United States
- /
- Professional Services
- /
- NYSE:TRU
TransUnion (NYSE:TRU) Has A Somewhat Strained Balance Sheet


David Iben put it well when he said, 'Volatility is not a risk we care about. What we care about is avoiding the permanent loss of capital.' So it might be obvious that you need to consider debt, when you think about how risky any given stock is, because too much debt can sink a company. Importantly, TransUnion (NYSE:TRU) does carry debt. But the real question is whether this debt is making the company risky.
What Risk Does Debt Bring?
Debt is a tool to help businesses grow, but if a business is incapable of paying off its lenders, then it exists at their mercy. Part and parcel of capitalism is the process of 'creative destruction' where failed businesses are mercilessly liquidated by their bankers. However, a more usual (but still expensive) situation is where a company must dilute shareholders at a cheap share price simply to get debt under control. Of course, plenty of companies use debt to fund growth, without any negative consequences. When we examine debt levels, we first consider both cash and debt levels, together.
View our latest analysis for TransUnion
What Is TransUnion's Net Debt?
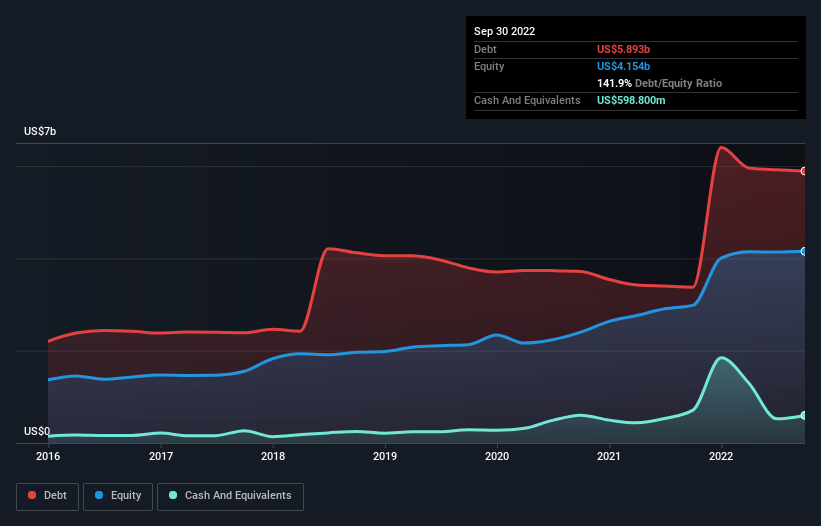
The image below, which you can click on for greater detail, shows that at September 2022 TransUnion had debt of US$5.89b, up from US$3.38b in one year. However, because it has a cash reserve of US$598.8m, its net debt is less, at about US$5.29b.
A Look At TransUnion's Liabilities
We can see from the most recent balance sheet that TransUnion had liabilities of US$889.9m falling due within a year, and liabilities of US$6.76b due beyond that. Offsetting this, it had US$598.8m in cash and US$642.8m in receivables that were due within 12 months. So its liabilities total US$6.41b more than the combination of its cash and short-term receivables.
While this might seem like a lot, it is not so bad since TransUnion has a huge market capitalization of US$11.6b, and so it could probably strengthen its balance sheet by raising capital if it needed to. But it's clear that we should definitely closely examine whether it can manage its debt without dilution.
In order to size up a company's debt relative to its earnings, we calculate its net debt divided by its earnings before interest, tax, depreciation, and amortization (EBITDA) and its earnings before interest and tax (EBIT) divided by its interest expense (its interest cover). The advantage of this approach is that we take into account both the absolute quantum of debt (with net debt to EBITDA) and the actual interest expenses associated with that debt (with its interest cover ratio).
TransUnion has a debt to EBITDA ratio of 4.8 and its EBIT covered its interest expense 3.1 times. Taken together this implies that, while we wouldn't want to see debt levels rise, we think it can handle its current leverage. More concerning, TransUnion saw its EBIT drop by 3.6% in the last twelve months. If that earnings trend continues the company will face an uphill battle to pay off its debt. The balance sheet is clearly the area to focus on when you are analysing debt. But ultimately the future profitability of the business will decide if TransUnion can strengthen its balance sheet over time. So if you're focused on the future you can check out this free report showing analyst profit forecasts.
Finally, while the tax-man may adore accounting profits, lenders only accept cold hard cash. So we clearly need to look at whether that EBIT is leading to corresponding free cash flow. Over the most recent three years, TransUnion recorded free cash flow worth 64% of its EBIT, which is around normal, given free cash flow excludes interest and tax. This cold hard cash means it can reduce its debt when it wants to.
Our View
While TransUnion's interest cover makes us cautious about it, its track record of managing its debt, based on its EBITDA, is no better. At least its conversion of EBIT to free cash flow gives us reason to be optimistic. When we consider all the factors discussed, it seems to us that TransUnion is taking some risks with its use of debt. While that debt can boost returns, we think the company has enough leverage now. The balance sheet is clearly the area to focus on when you are analysing debt. However, not all investment risk resides within the balance sheet - far from it. Case in point: We've spotted 2 warning signs for TransUnion you should be aware of, and 1 of them is potentially serious.
When all is said and done, sometimes its easier to focus on companies that don't even need debt. Readers can access a list of growth stocks with zero net debt 100% free, right now.
Valuation is complex, but we're helping make it simple.
Find out whether TransUnion is potentially over or undervalued by checking out our comprehensive analysis, which includes fair value estimates, risks and warnings, dividends, insider transactions and financial health.
View the Free AnalysisHave feedback on this article? Concerned about the content? Get in touch with us directly. Alternatively, email editorial-team (at) simplywallst.com.
This article by Simply Wall St is general in nature. We provide commentary based on historical data and analyst forecasts only using an unbiased methodology and our articles are not intended to be financial advice. It does not constitute a recommendation to buy or sell any stock, and does not take account of your objectives, or your financial situation. We aim to bring you long-term focused analysis driven by fundamental data. Note that our analysis may not factor in the latest price-sensitive company announcements or qualitative material. Simply Wall St has no position in any stocks mentioned.
About NYSE:TRU
TransUnion
Operates as a global consumer credit reporting agency that provides risk and information solutions.
Good value with moderate growth potential.
