- United States
- /
- Professional Services
- /
- NYSE:TBI
Here's What's Concerning About TrueBlue's (NYSE:TBI) Returns On Capital

To avoid investing in a business that's in decline, there's a few financial metrics that can provide early indications of aging. More often than not, we'll see a declining return on capital employed (ROCE) and a declining amount of capital employed. This indicates to us that the business is not only shrinking the size of its net assets, but its returns are falling as well. In light of that, from a first glance at TrueBlue (NYSE:TBI), we've spotted some signs that it could be struggling, so let's investigate.
What Is Return On Capital Employed (ROCE)?
For those who don't know, ROCE is a measure of a company's yearly pre-tax profit (its return), relative to the capital employed in the business. Analysts use this formula to calculate it for TrueBlue:
Return on Capital Employed = Earnings Before Interest and Tax (EBIT) ÷ (Total Assets - Current Liabilities)
0.069 = US$51m ÷ (US$957m - US$215m) (Based on the trailing twelve months to March 2023).
Thus, TrueBlue has an ROCE of 6.9%. In absolute terms, that's a low return and it also under-performs the Professional Services industry average of 12%.
Check out our latest analysis for TrueBlue
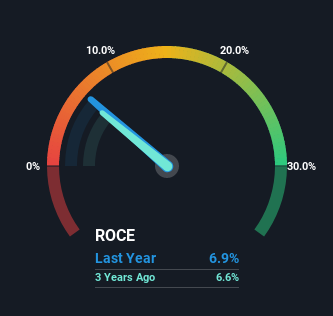
In the above chart we have measured TrueBlue's prior ROCE against its prior performance, but the future is arguably more important. If you're interested, you can view the analysts predictions in our free report on analyst forecasts for the company.
SWOT Analysis for TrueBlue
- Currently debt free.
- Earnings declined over the past year.
- Annual earnings are forecast to grow for the next 2 years.
- Good value based on P/E ratio and estimated fair value.
- Significant insider buying over the past 3 months.
- Annual earnings are forecast to grow slower than the American market.
How Are Returns Trending?
There is reason to be cautious about TrueBlue, given the returns are trending downwards. Unfortunately the returns on capital have diminished from the 9.1% that they were earning five years ago. Meanwhile, capital employed in the business has stayed roughly the flat over the period. Companies that exhibit these attributes tend to not be shrinking, but they can be mature and facing pressure on their margins from competition. If these trends continue, we wouldn't expect TrueBlue to turn into a multi-bagger.
In Conclusion...
In summary, it's unfortunate that TrueBlue is generating lower returns from the same amount of capital. Long term shareholders who've owned the stock over the last five years have experienced a 32% depreciation in their investment, so it appears the market might not like these trends either. Unless there is a shift to a more positive trajectory in these metrics, we would look elsewhere.
If you're still interested in TrueBlue it's worth checking out our FREE intrinsic value approximation to see if it's trading at an attractive price in other respects.
While TrueBlue isn't earning the highest return, check out this free list of companies that are earning high returns on equity with solid balance sheets.
The New Payments ETF Is Live on NASDAQ:
Money is moving to real-time rails, and a newly listed ETF now gives investors direct exposure. Fast settlement. Institutional custody. Simple access.
Explore how this launch could reshape portfolios
Sponsored ContentValuation is complex, but we're here to simplify it.
Discover if TrueBlue might be undervalued or overvalued with our detailed analysis, featuring fair value estimates, potential risks, dividends, insider trades, and its financial condition.
Access Free AnalysisHave feedback on this article? Concerned about the content? Get in touch with us directly. Alternatively, email editorial-team (at) simplywallst.com.
This article by Simply Wall St is general in nature. We provide commentary based on historical data and analyst forecasts only using an unbiased methodology and our articles are not intended to be financial advice. It does not constitute a recommendation to buy or sell any stock, and does not take account of your objectives, or your financial situation. We aim to bring you long-term focused analysis driven by fundamental data. Note that our analysis may not factor in the latest price-sensitive company announcements or qualitative material. Simply Wall St has no position in any stocks mentioned.
About NYSE:TBI
TrueBlue
Provides specialized workforce solutions in the United States, Canada, the United Kingdom, Australia, and Puerto Rico.
Undervalued with moderate growth potential.
Similar Companies
Market Insights

Weekly Picks

THE KINGDOM OF BROWN GOODS: WHY MGPI IS BEING CRUSHED BY INVENTORY & PRIMED FOR RESURRECTION


Why Vertical Aerospace (NYSE: EVTL) is Worth Possibly Over 13x its Current Price


The Quiet Giant That Became AI’s Power Grid
Recently Updated Narratives

Deep Value Multi Bagger Opportunity


A case for CA$31.80 (undiluted), aka 8,616% upside from CA$0.37 (an 86 bagger!).


Unicycive Therapeutics (Nasdaq: UNCY) – Preparing for a Second Shot at Bringing a New Kidney Treatment to Market (TEST)
Popular Narratives


MicroVision will explode future revenue by 380.37% with a vision towards success


NVDA: Expanding AI Demand Will Drive Major Data Center Investments Through 2026


Crazy Undervalued 42 Baggers Silver Play (Active & Running Mine)
Trending Discussion

