
Advertisement
- United States
- /
- Professional Services
- /
- NYSE:PAYC
Capital Investment Trends At Paycom Software (NYSE:PAYC) Look Strong
There are a few key trends to look for if we want to identify the next multi-bagger. One common approach is to try and find a company with returns on capital employed (ROCE) that are increasing, in conjunction with a growing amount of capital employed. Ultimately, this demonstrates that it's a business that is reinvesting profits at increasing rates of return. So, when we ran our eye over Paycom Software's (NYSE:PAYC) trend of ROCE, we really liked what we saw.
What Is Return On Capital Employed (ROCE)?
For those who don't know, ROCE is a measure of a company's yearly pre-tax profit (its return), relative to the capital employed in the business. To calculate this metric for Paycom Software, this is the formula:
Return on Capital Employed = Earnings Before Interest and Tax (EBIT) ÷ (Total Assets - Current Liabilities)
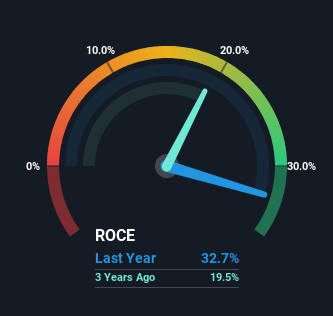
0.33 = US$585m ÷ (US$4.3b - US$2.5b) (Based on the trailing twelve months to June 2024).
Thus, Paycom Software has an ROCE of 33%. That's a fantastic return and not only that, it outpaces the average of 14% earned by companies in a similar industry.
Check out our latest analysis for Paycom Software
Above you can see how the current ROCE for Paycom Software compares to its prior returns on capital, but there's only so much you can tell from the past. If you'd like to see what analysts are forecasting going forward, you should check out our free analyst report for Paycom Software .
What Can We Tell From Paycom Software's ROCE Trend?
In terms of Paycom Software's history of ROCE, it's quite impressive. Over the past five years, ROCE has remained relatively flat at around 33% and the business has deployed 186% more capital into its operations. Returns like this are the envy of most businesses and given it has repeatedly reinvested at these rates, that's even better. If these trends can continue, it wouldn't surprise us if the company became a multi-bagger.
On a separate but related note, it's important to know that Paycom Software has a current liabilities to total assets ratio of 59%, which we'd consider pretty high. This effectively means that suppliers (or short-term creditors) are funding a large portion of the business, so just be aware that this can introduce some elements of risk. While it's not necessarily a bad thing, it can be beneficial if this ratio is lower.
The Key Takeaway
In the end, the company has proven it can reinvest it's capital at high rates of returns, which you'll remember is a trait of a multi-bagger. Yet over the last five years the stock has declined 21%, so the decline might provide an opening. That's why we think it'd be worthwhile to look further into this stock given the fundamentals are appealing.
On a final note, we've found 1 warning sign for Paycom Software that we think you should be aware of.
If you want to search for more stocks that have been earning high returns, check out this free list of stocks with solid balance sheets that are also earning high returns on equity.
New: Manage All Your Stock Portfolios in One Place
We've created the ultimate portfolio companion for stock investors, and it's free.
• Connect an unlimited number of Portfolios and see your total in one currency
• Be alerted to new Warning Signs or Risks via email or mobile
• Track the Fair Value of your stocks
Have feedback on this article? Concerned about the content? Get in touch with us directly. Alternatively, email editorial-team (at) simplywallst.com.
This article by Simply Wall St is general in nature. We provide commentary based on historical data and analyst forecasts only using an unbiased methodology and our articles are not intended to be financial advice. It does not constitute a recommendation to buy or sell any stock, and does not take account of your objectives, or your financial situation. We aim to bring you long-term focused analysis driven by fundamental data. Note that our analysis may not factor in the latest price-sensitive company announcements or qualitative material. Simply Wall St has no position in any stocks mentioned.
About NYSE:PAYC
Paycom Software
Provides cloud-based human capital management (HCM) solution delivered as software-as-a-service for small to mid-sized companies in the United States.
Flawless balance sheet and slightly overvalued.
Similar Companies
Market Insights


Advertisement
Community Narratives
America Wants Homegrown Drones — Draganfly Is Ready to Deliver
Fair Value US$9.21|27.4% undervalued
JO
Community Contributor
Cheesecake Factory offers an enticing opportunity for long-term growth by leveraging new concepts
Fair Value US$73.83|25.8% undervalued
ZW
Community Contributor
Coca-Cola’s Intrinsic Value Set to Rise with Fed Rate Cut
Fair Value US$67.50|2.7% undervalued
AL
Community Contributor
Fully Permitted Gold Mine with 50 Baggers Potential 
Fair Value CA$41.00|98.0% undervalued
RO
Community Contributor