- United States
- /
- Professional Services
- /
- NYSE:MAN
ManpowerGroup (NYSE:MAN) investors are sitting on a loss of 33% if they invested three years ago


Many investors define successful investing as beating the market average over the long term. But the risk of stock picking is that you will likely buy under-performing companies. Unfortunately, that's been the case for longer term ManpowerGroup Inc. (NYSE:MAN) shareholders, since the share price is down 38% in the last three years, falling well short of the market return of around 20%.
So let's have a look and see if the longer term performance of the company has been in line with the underlying business' progress.
See our latest analysis for ManpowerGroup
While the efficient markets hypothesis continues to be taught by some, it has been proven that markets are over-reactive dynamic systems, and investors are not always rational. By comparing earnings per share (EPS) and share price changes over time, we can get a feel for how investor attitudes to a company have morphed over time.
During the three years that the share price fell, ManpowerGroup's earnings per share (EPS) dropped by 10% each year. The share price decline of 15% is actually steeper than the EPS slippage. So it's likely that the EPS decline has disappointed the market, leaving investors hesitant to buy. Having said that, the market is still optimistic, given the P/E ratio of 70.25.
The image below shows how EPS has tracked over time (if you click on the image you can see greater detail).
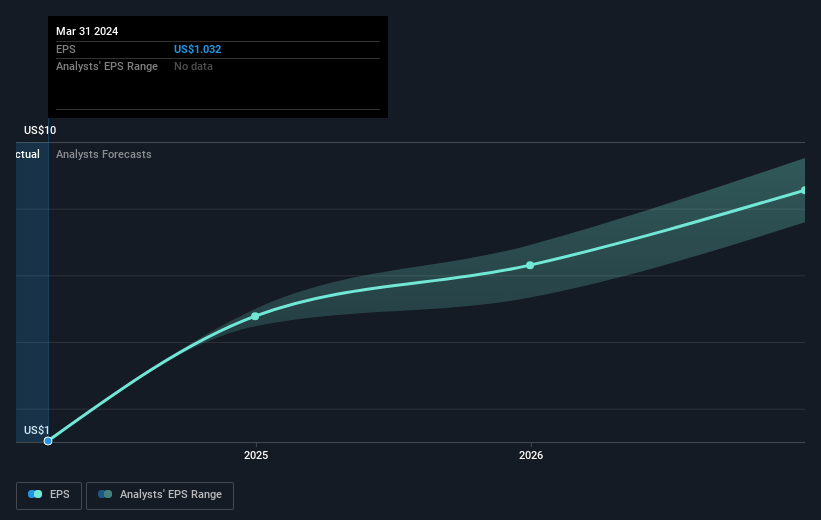
This free interactive report on ManpowerGroup's earnings, revenue and cash flow is a great place to start, if you want to investigate the stock further.
What About Dividends?
When looking at investment returns, it is important to consider the difference between total shareholder return (TSR) and share price return. The TSR is a return calculation that accounts for the value of cash dividends (assuming that any dividend received was reinvested) and the calculated value of any discounted capital raisings and spin-offs. Arguably, the TSR gives a more comprehensive picture of the return generated by a stock. In the case of ManpowerGroup, it has a TSR of -33% for the last 3 years. That exceeds its share price return that we previously mentioned. This is largely a result of its dividend payments!
A Different Perspective
ManpowerGroup provided a TSR of 7.4% over the last twelve months. Unfortunately this falls short of the market return. On the bright side, that's still a gain, and it is certainly better than the yearly loss of about 0.5% endured over half a decade. It could well be that the business is stabilizing. I find it very interesting to look at share price over the long term as a proxy for business performance. But to truly gain insight, we need to consider other information, too. For example, we've discovered 3 warning signs for ManpowerGroup that you should be aware of before investing here.
We will like ManpowerGroup better if we see some big insider buys. While we wait, check out this free list of undervalued stocks (mostly small caps) with considerable, recent, insider buying.
Please note, the market returns quoted in this article reflect the market weighted average returns of stocks that currently trade on American exchanges.
New: Manage All Your Stock Portfolios in One Place
We've created the ultimate portfolio companion for stock investors, and it's free.
• Connect an unlimited number of Portfolios and see your total in one currency
• Be alerted to new Warning Signs or Risks via email or mobile
• Track the Fair Value of your stocks
Have feedback on this article? Concerned about the content? Get in touch with us directly. Alternatively, email editorial-team (at) simplywallst.com.
This article by Simply Wall St is general in nature. We provide commentary based on historical data and analyst forecasts only using an unbiased methodology and our articles are not intended to be financial advice. It does not constitute a recommendation to buy or sell any stock, and does not take account of your objectives, or your financial situation. We aim to bring you long-term focused analysis driven by fundamental data. Note that our analysis may not factor in the latest price-sensitive company announcements or qualitative material. Simply Wall St has no position in any stocks mentioned.
About NYSE:MAN
Very undervalued with excellent balance sheet and pays a dividend.
Similar Companies
Market Insights

Community Narratives

