- United States
- /
- Professional Services
- /
- NYSE:CBZ
Are Investors Undervaluing CBIZ, Inc. (NYSE:CBZ) By 42%?


Key Insights
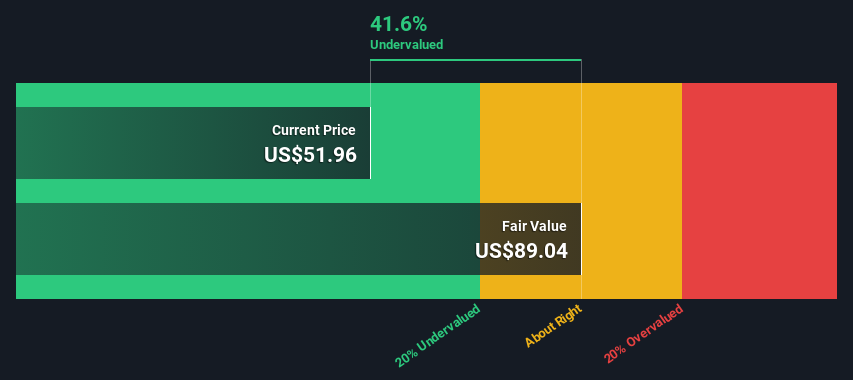
- The projected fair value for CBIZ is US$89.04 based on 2 Stage Free Cash Flow to Equity
- CBIZ is estimated to be 42% undervalued based on current share price of US$51.96
- The US$60.00 analyst price target for CBZ is 33% less than our estimate of fair value
How far off is CBIZ, Inc. (NYSE:CBZ) from its intrinsic value? Using the most recent financial data, we'll take a look at whether the stock is fairly priced by taking the expected future cash flows and discounting them to their present value. Our analysis will employ the Discounted Cash Flow (DCF) model. Before you think you won't be able to understand it, just read on! It's actually much less complex than you'd imagine.
We generally believe that a company's value is the present value of all of the cash it will generate in the future. However, a DCF is just one valuation metric among many, and it is not without flaws. For those who are keen learners of equity analysis, the Simply Wall St analysis model here may be something of interest to you.
See our latest analysis for CBIZ
The Method
We use what is known as a 2-stage model, which simply means we have two different periods of growth rates for the company's cash flows. Generally the first stage is higher growth, and the second stage is a lower growth phase. In the first stage we need to estimate the cash flows to the business over the next ten years. Where possible we use analyst estimates, but when these aren't available we extrapolate the previous free cash flow (FCF) from the last estimate or reported value. We assume companies with shrinking free cash flow will slow their rate of shrinkage, and that companies with growing free cash flow will see their growth rate slow, over this period. We do this to reflect that growth tends to slow more in the early years than it does in later years.
Generally we assume that a dollar today is more valuable than a dollar in the future, so we discount the value of these future cash flows to their estimated value in today's dollars:
10-year free cash flow (FCF) estimate
| 2024 | 2025 | 2026 | 2027 | 2028 | 2029 | 2030 | 2031 | 2032 | 2033 | |
| Levered FCF ($, Millions) | US$170.3m | US$190.3m | US$205.0m | US$217.5m | US$228.1m | US$237.4m | US$245.7m | US$253.3m | US$260.5m | US$267.3m |
| Growth Rate Estimate Source | Analyst x1 | Analyst x1 | Est @ 7.76% | Est @ 6.08% | Est @ 4.90% | Est @ 4.08% | Est @ 3.50% | Est @ 3.09% | Est @ 2.81% | Est @ 2.61% |
| Present Value ($, Millions) Discounted @ 7.0% | US$159 | US$166 | US$167 | US$166 | US$163 | US$158 | US$153 | US$147 | US$142 | US$136 |
("Est" = FCF growth rate estimated by Simply Wall St)
Present Value of 10-year Cash Flow (PVCF) = US$1.6b
The second stage is also known as Terminal Value, this is the business's cash flow after the first stage. The Gordon Growth formula is used to calculate Terminal Value at a future annual growth rate equal to the 5-year average of the 10-year government bond yield of 2.2%. We discount the terminal cash flows to today's value at a cost of equity of 7.0%.
Terminal Value (TV)= FCF2033 × (1 + g) ÷ (r – g) = US$267m× (1 + 2.2%) ÷ (7.0%– 2.2%) = US$5.6b
Present Value of Terminal Value (PVTV)= TV / (1 + r)10= US$5.6b÷ ( 1 + 7.0%)10= US$2.9b
The total value, or equity value, is then the sum of the present value of the future cash flows, which in this case is US$4.4b. In the final step we divide the equity value by the number of shares outstanding. Relative to the current share price of US$52.0, the company appears quite undervalued at a 42% discount to where the stock price trades currently. The assumptions in any calculation have a big impact on the valuation, so it is better to view this as a rough estimate, not precise down to the last cent.
Important Assumptions
The calculation above is very dependent on two assumptions. The first is the discount rate and the other is the cash flows. If you don't agree with these result, have a go at the calculation yourself and play with the assumptions. The DCF also does not consider the possible cyclicality of an industry, or a company's future capital requirements, so it does not give a full picture of a company's potential performance. Given that we are looking at CBIZ as potential shareholders, the cost of equity is used as the discount rate, rather than the cost of capital (or weighted average cost of capital, WACC) which accounts for debt. In this calculation we've used 7.0%, which is based on a levered beta of 0.970. Beta is a measure of a stock's volatility, compared to the market as a whole. We get our beta from the industry average beta of globally comparable companies, with an imposed limit between 0.8 and 2.0, which is a reasonable range for a stable business.
SWOT Analysis for CBIZ
- Earnings growth over the past year exceeded the industry.
- Debt is well covered by earnings and cashflows.
- No major weaknesses identified for CBZ.
- Annual earnings are forecast to grow for the next 2 years.
- Trading below our estimate of fair value by more than 20%.
- Annual earnings are forecast to grow slower than the American market.
Next Steps:
Whilst important, the DCF calculation is only one of many factors that you need to assess for a company. It's not possible to obtain a foolproof valuation with a DCF model. Instead the best use for a DCF model is to test certain assumptions and theories to see if they would lead to the company being undervalued or overvalued. If a company grows at a different rate, or if its cost of equity or risk free rate changes sharply, the output can look very different. Why is the intrinsic value higher than the current share price? For CBIZ, we've compiled three pertinent factors you should further examine:
- Risks: Consider for instance, the ever-present spectre of investment risk. We've identified 2 warning signs with CBIZ , and understanding them should be part of your investment process.
- Management:Have insiders been ramping up their shares to take advantage of the market's sentiment for CBZ's future outlook? Check out our management and board analysis with insights on CEO compensation and governance factors.
- Other High Quality Alternatives: Do you like a good all-rounder? Explore our interactive list of high quality stocks to get an idea of what else is out there you may be missing!
PS. The Simply Wall St app conducts a discounted cash flow valuation for every stock on the NYSE every day. If you want to find the calculation for other stocks just search here.
If you're looking to trade CBIZ, open an account with the lowest-cost platform trusted by professionals, Interactive Brokers.
With clients in over 200 countries and territories, and access to 160 markets, IBKR lets you trade stocks, options, futures, forex, bonds and funds from a single integrated account.
Enjoy no hidden fees, no account minimums, and FX conversion rates as low as 0.03%, far better than what most brokers offer.
Sponsored ContentNew: AI Stock Screener & Alerts
Our new AI Stock Screener scans the market every day to uncover opportunities.
• Dividend Powerhouses (3%+ Yield)
• Undervalued Small Caps with Insider Buying
• High growth Tech and AI Companies
Or build your own from over 50 metrics.
Have feedback on this article? Concerned about the content? Get in touch with us directly. Alternatively, email editorial-team (at) simplywallst.com.
This article by Simply Wall St is general in nature. We provide commentary based on historical data and analyst forecasts only using an unbiased methodology and our articles are not intended to be financial advice. It does not constitute a recommendation to buy or sell any stock, and does not take account of your objectives, or your financial situation. We aim to bring you long-term focused analysis driven by fundamental data. Note that our analysis may not factor in the latest price-sensitive company announcements or qualitative material. Simply Wall St has no position in any stocks mentioned.
About NYSE:CBZ
CBIZ
Provides financial, insurance, and advisory services in the United States and Canada.
High growth potential slight.
Similar Companies
Market Insights

Community Narratives

