
Advertisement
- United States
- /
- Commercial Services
- /
- NasdaqGS:TILE
Interface, Inc.'s (NASDAQ:TILE) P/E Is Still On The Mark Following 26% Share Price Bounce

Despite an already strong run, Interface, Inc. (NASDAQ:TILE) shares have been powering on, with a gain of 26% in the last thirty days. Looking back a bit further, it's encouraging to see the stock is up 67% in the last year.
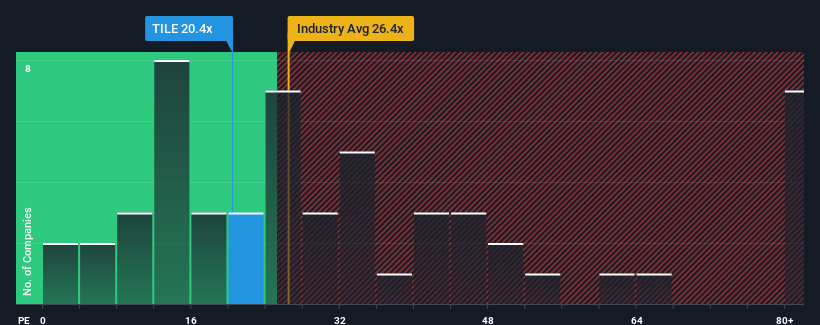
Since its price has surged higher, Interface's price-to-earnings (or "P/E") ratio of 20.4x might make it look like a sell right now compared to the market in the United States, where around half of the companies have P/E ratios below 16x and even P/E's below 9x are quite common. Although, it's not wise to just take the P/E at face value as there may be an explanation why it's as high as it is.
Interface certainly has been doing a good job lately as its earnings growth has been positive while most other companies have been seeing their earnings go backwards. It seems that many are expecting the company to continue defying the broader market adversity, which has increased investors’ willingness to pay up for the stock. You'd really hope so, otherwise you're paying a pretty hefty price for no particular reason.
View our latest analysis for Interface
What Are Growth Metrics Telling Us About The High P/E?
The only time you'd be truly comfortable seeing a P/E as high as Interface's is when the company's growth is on track to outshine the market.
Taking a look back first, we see that the company grew earnings per share by an impressive 125% last year. However, the latest three year period hasn't been as great in aggregate as it didn't manage to provide any growth at all. So it appears to us that the company has had a mixed result in terms of growing earnings over that time.
Looking ahead now, EPS is anticipated to climb by 24% each year during the coming three years according to the three analysts following the company. With the market only predicted to deliver 11% per year, the company is positioned for a stronger earnings result.
With this information, we can see why Interface is trading at such a high P/E compared to the market. Apparently shareholders aren't keen to offload something that is potentially eyeing a more prosperous future.
The Bottom Line On Interface's P/E
The large bounce in Interface's shares has lifted the company's P/E to a fairly high level. It's argued the price-to-earnings ratio is an inferior measure of value within certain industries, but it can be a powerful business sentiment indicator.
We've established that Interface maintains its high P/E on the strength of its forecast growth being higher than the wider market, as expected. At this stage investors feel the potential for a deterioration in earnings isn't great enough to justify a lower P/E ratio. It's hard to see the share price falling strongly in the near future under these circumstances.
It's always necessary to consider the ever-present spectre of investment risk. We've identified 1 warning sign with Interface, and understanding should be part of your investment process.
Of course, you might also be able to find a better stock than Interface. So you may wish to see this free collection of other companies that have reasonable P/E ratios and have grown earnings strongly.
New: AI Stock Screener & Alerts
Our new AI Stock Screener scans the market every day to uncover opportunities.
• Dividend Powerhouses (3%+ Yield)
• Undervalued Small Caps with Insider Buying
• High growth Tech and AI Companies
Or build your own from over 50 metrics.
Have feedback on this article? Concerned about the content? Get in touch with us directly. Alternatively, email editorial-team (at) simplywallst.com.
This article by Simply Wall St is general in nature. We provide commentary based on historical data and analyst forecasts only using an unbiased methodology and our articles are not intended to be financial advice. It does not constitute a recommendation to buy or sell any stock, and does not take account of your objectives, or your financial situation. We aim to bring you long-term focused analysis driven by fundamental data. Note that our analysis may not factor in the latest price-sensitive company announcements or qualitative material. Simply Wall St has no position in any stocks mentioned.
About NasdaqGS:TILE
Interface
Designs, produces, and sells modular carpet products in the United States, Canada, Latin America, Europe, Africa, Asia, and Australia.
Very undervalued with flawless balance sheet.
Similar Companies
Market Insights

Advertisement
Community Narratives
Pinterest will surge as advertising innovations ignite revenue growth
Fair Value US$42.63|26.3% undervalued
BR
Community Contributor
Brambles' Revenue Set to Climb 14% with Profit Margins Following
Fair Value AU$21.90|4.9% overvalued
RO
Community Contributor
Challenging Future for STG as Organic Sales Decline by 8.8%
Fair Value DKK 116.13|26.8% undervalued
KA
Community Contributor