- United States
- /
- Commercial Services
- /
- NasdaqGS:HCCI
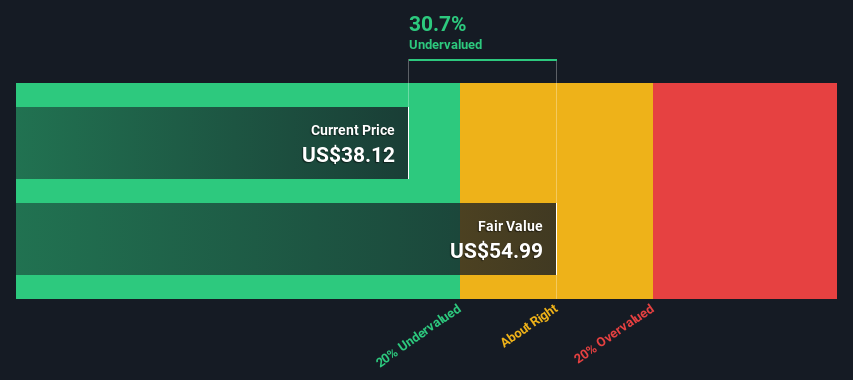
Heritage-Crystal Clean, Inc (NASDAQ:HCCI) Shares Could Be 31% Below Their Intrinsic Value Estimate


Key Insights
- The projected fair value for Heritage-Crystal Clean is US$54.99 based on 2 Stage Free Cash Flow to Equity
- Heritage-Crystal Clean's US$38.12 share price signals that it might be 31% undervalued
- Analyst price target for HCCI is US$44.50 which is 19% below our fair value estimate
In this article we are going to estimate the intrinsic value of Heritage-Crystal Clean, Inc (NASDAQ:HCCI) by taking the forecast future cash flows of the company and discounting them back to today's value. We will use the Discounted Cash Flow (DCF) model on this occasion. It may sound complicated, but actually it is quite simple!
Remember though, that there are many ways to estimate a company's value, and a DCF is just one method. If you want to learn more about discounted cash flow, the rationale behind this calculation can be read in detail in the Simply Wall St analysis model.
See our latest analysis for Heritage-Crystal Clean
Crunching The Numbers
We're using the 2-stage growth model, which simply means we take in account two stages of company's growth. In the initial period the company may have a higher growth rate and the second stage is usually assumed to have a stable growth rate. In the first stage we need to estimate the cash flows to the business over the next ten years. Where possible we use analyst estimates, but when these aren't available we extrapolate the previous free cash flow (FCF) from the last estimate or reported value. We assume companies with shrinking free cash flow will slow their rate of shrinkage, and that companies with growing free cash flow will see their growth rate slow, over this period. We do this to reflect that growth tends to slow more in the early years than it does in later years.
A DCF is all about the idea that a dollar in the future is less valuable than a dollar today, so we need to discount the sum of these future cash flows to arrive at a present value estimate:
10-year free cash flow (FCF) forecast
| 2024 | 2025 | 2026 | 2027 | 2028 | 2029 | 2030 | 2031 | 2032 | 2033 | |
| Levered FCF ($, Millions) | US$74.1m | US$77.4m | US$80.3m | US$82.9m | US$85.3m | US$87.5m | US$89.7m | US$91.8m | US$94.0m | US$96.1m |
| Growth Rate Estimate Source | Analyst x2 | Est @ 4.40% | Est @ 3.71% | Est @ 3.23% | Est @ 2.89% | Est @ 2.66% | Est @ 2.49% | Est @ 2.38% | Est @ 2.30% | Est @ 2.24% |
| Present Value ($, Millions) Discounted @ 8.0% | US$68.6 | US$66.4 | US$63.7 | US$60.9 | US$58.0 | US$55.2 | US$52.4 | US$49.6 | US$47.0 | US$44.5 |
("Est" = FCF growth rate estimated by Simply Wall St)
Present Value of 10-year Cash Flow (PVCF) = US$566m
The second stage is also known as Terminal Value, this is the business's cash flow after the first stage. The Gordon Growth formula is used to calculate Terminal Value at a future annual growth rate equal to the 5-year average of the 10-year government bond yield of 2.1%. We discount the terminal cash flows to today's value at a cost of equity of 8.0%.
Terminal Value (TV)= FCF2033 × (1 + g) ÷ (r – g) = US$96m× (1 + 2.1%) ÷ (8.0%– 2.1%) = US$1.7b
Present Value of Terminal Value (PVTV)= TV / (1 + r)10= US$1.7b÷ ( 1 + 8.0%)10= US$773m
The total value is the sum of cash flows for the next ten years plus the discounted terminal value, which results in the Total Equity Value, which in this case is US$1.3b. To get the intrinsic value per share, we divide this by the total number of shares outstanding. Relative to the current share price of US$38.1, the company appears quite undervalued at a 31% discount to where the stock price trades currently. The assumptions in any calculation have a big impact on the valuation, so it is better to view this as a rough estimate, not precise down to the last cent.
Important Assumptions
We would point out that the most important inputs to a discounted cash flow are the discount rate and of course the actual cash flows. Part of investing is coming up with your own evaluation of a company's future performance, so try the calculation yourself and check your own assumptions. The DCF also does not consider the possible cyclicality of an industry, or a company's future capital requirements, so it does not give a full picture of a company's potential performance. Given that we are looking at Heritage-Crystal Clean as potential shareholders, the cost of equity is used as the discount rate, rather than the cost of capital (or weighted average cost of capital, WACC) which accounts for debt. In this calculation we've used 8.0%, which is based on a levered beta of 0.991. Beta is a measure of a stock's volatility, compared to the market as a whole. We get our beta from the industry average beta of globally comparable companies, with an imposed limit between 0.8 and 2.0, which is a reasonable range for a stable business.
SWOT Analysis for Heritage-Crystal Clean
- Earnings growth over the past year exceeded the industry.
- Debt is not viewed as a risk.
- Earnings growth over the past year is below its 5-year average.
- Good value based on P/E ratio and estimated fair value.
- Annual earnings are forecast to decline for the next 2 years.
Looking Ahead:
Although the valuation of a company is important, it ideally won't be the sole piece of analysis you scrutinize for a company. It's not possible to obtain a foolproof valuation with a DCF model. Preferably you'd apply different cases and assumptions and see how they would impact the company's valuation. For instance, if the terminal value growth rate is adjusted slightly, it can dramatically alter the overall result. Can we work out why the company is trading at a discount to intrinsic value? For Heritage-Crystal Clean, we've put together three fundamental elements you should look at:
- Risks: Be aware that Heritage-Crystal Clean is showing 1 warning sign in our investment analysis , you should know about...
- Future Earnings: How does HCCI's growth rate compare to its peers and the wider market? Dig deeper into the analyst consensus number for the upcoming years by interacting with our free analyst growth expectation chart.
- Other Solid Businesses: Low debt, high returns on equity and good past performance are fundamental to a strong business. Why not explore our interactive list of stocks with solid business fundamentals to see if there are other companies you may not have considered!
PS. The Simply Wall St app conducts a discounted cash flow valuation for every stock on the NASDAQGS every day. If you want to find the calculation for other stocks just search here.
Valuation is complex, but we're here to simplify it.
Discover if Heritage-Crystal Clean might be undervalued or overvalued with our detailed analysis, featuring fair value estimates, potential risks, dividends, insider trades, and its financial condition.
Access Free AnalysisHave feedback on this article? Concerned about the content? Get in touch with us directly. Alternatively, email editorial-team (at) simplywallst.com.
This article by Simply Wall St is general in nature. We provide commentary based on historical data and analyst forecasts only using an unbiased methodology and our articles are not intended to be financial advice. It does not constitute a recommendation to buy or sell any stock, and does not take account of your objectives, or your financial situation. We aim to bring you long-term focused analysis driven by fundamental data. Note that our analysis may not factor in the latest price-sensitive company announcements or qualitative material. Simply Wall St has no position in any stocks mentioned.
About NasdaqGS:HCCI
Heritage-Crystal Clean
Heritage-Crystal Clean, Inc, through its subsidiary, Heritage-Crystal Clean, LLC, provides parts cleaning, hazardous and non-hazardous waste, and used oil collection services to small and mid-sized customers in the industrial and vehicle maintenance sectors in North America.
Adequate balance sheet with acceptable track record.
Similar Companies
Market Insights

Community Narratives


