
Advertisement
Some say volatility, rather than debt, is the best way to think about risk as an investor, but Warren Buffett famously said that 'Volatility is far from synonymous with risk.' When we think about how risky a company is, we always like to look at its use of debt, since debt overload can lead to ruin. We can see that Xylem Inc. (NYSE:XYL) does use debt in its business. But the more important question is: how much risk is that debt creating?
When Is Debt Dangerous?
Generally speaking, debt only becomes a real problem when a company can't easily pay it off, either by raising capital or with its own cash flow. If things get really bad, the lenders can take control of the business. However, a more frequent (but still costly) occurrence is where a company must issue shares at bargain-basement prices, permanently diluting shareholders, just to shore up its balance sheet. Of course, the upside of debt is that it often represents cheap capital, especially when it replaces dilution in a company with the ability to reinvest at high rates of return. When we think about a company's use of debt, we first look at cash and debt together.
What Is Xylem's Debt?
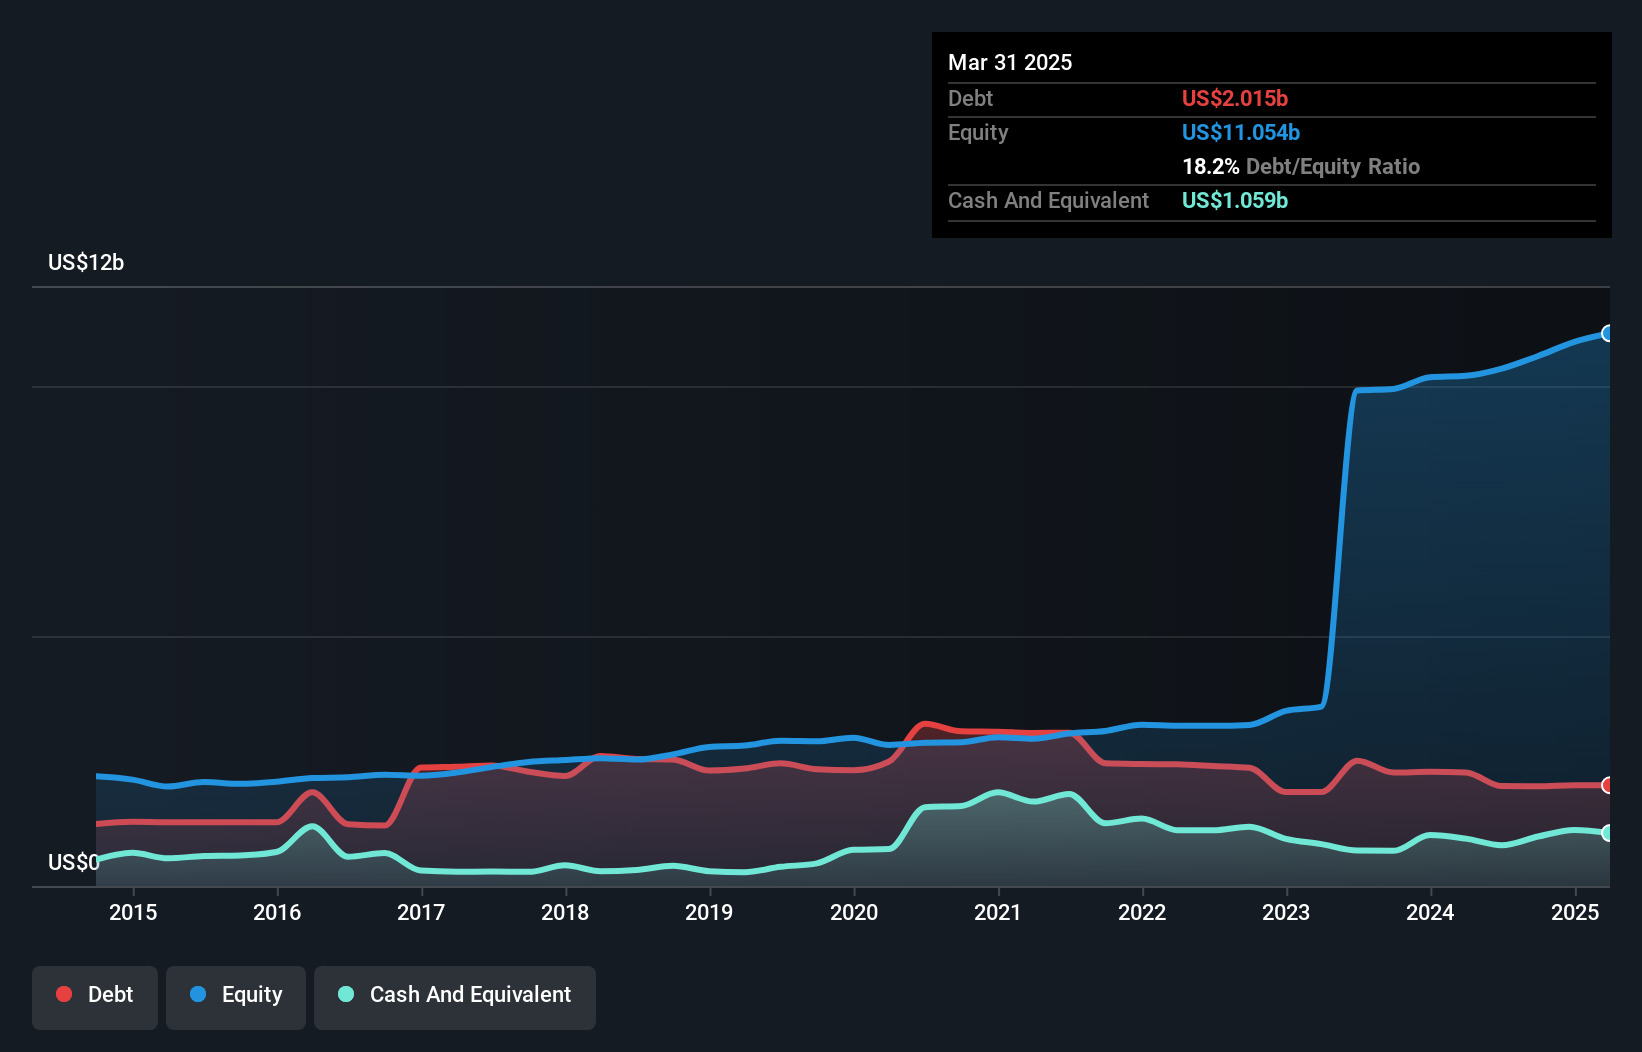
You can click the graphic below for the historical numbers, but it shows that Xylem had US$2.02b of debt in March 2025, down from US$2.27b, one year before. However, because it has a cash reserve of US$1.06b, its net debt is less, at about US$956.0m.
How Strong Is Xylem's Balance Sheet?
We can see from the most recent balance sheet that Xylem had liabilities of US$2.17b falling due within a year, and liabilities of US$3.34b due beyond that. On the other hand, it had cash of US$1.06b and US$1.75b worth of receivables due within a year. So its liabilities total US$2.70b more than the combination of its cash and short-term receivables.
Since publicly traded Xylem shares are worth a very impressive total of US$31.9b, it seems unlikely that this level of liabilities would be a major threat. Having said that, it's clear that we should continue to monitor its balance sheet, lest it change for the worse.
View our latest analysis for Xylem
We use two main ratios to inform us about debt levels relative to earnings. The first is net debt divided by earnings before interest, tax, depreciation, and amortization (EBITDA), while the second is how many times its earnings before interest and tax (EBIT) covers its interest expense (or its interest cover, for short). The advantage of this approach is that we take into account both the absolute quantum of debt (with net debt to EBITDA) and the actual interest expenses associated with that debt (with its interest cover ratio).
Xylem's net debt is only 0.55 times its EBITDA. And its EBIT covers its interest expense a whopping 115 times over. So we're pretty relaxed about its super-conservative use of debt. Also positive, Xylem grew its EBIT by 23% in the last year, and that should make it easier to pay down debt, going forward. The balance sheet is clearly the area to focus on when you are analysing debt. But ultimately the future profitability of the business will decide if Xylem can strengthen its balance sheet over time. So if you're focused on the future you can check out this free report showing analyst profit forecasts.
Finally, a business needs free cash flow to pay off debt; accounting profits just don't cut it. So we clearly need to look at whether that EBIT is leading to corresponding free cash flow. Over the most recent three years, Xylem recorded free cash flow worth 72% of its EBIT, which is around normal, given free cash flow excludes interest and tax. This free cash flow puts the company in a good position to pay down debt, when appropriate.
Our View
Xylem's interest cover suggests it can handle its debt as easily as Cristiano Ronaldo could score a goal against an under 14's goalkeeper. And that's just the beginning of the good news since its conversion of EBIT to free cash flow is also very heartening. Overall, we don't think Xylem is taking any bad risks, as its debt load seems modest. So we're not worried about the use of a little leverage on the balance sheet. Above most other metrics, we think its important to track how fast earnings per share is growing, if at all. If you've also come to that realization, you're in luck, because today you can view this interactive graph of Xylem's earnings per share history for free.
If, after all that, you're more interested in a fast growing company with a rock-solid balance sheet, then check out our list of net cash growth stocks without delay.
New: AI Stock Screener & Alerts
Our new AI Stock Screener scans the market every day to uncover opportunities.
• Dividend Powerhouses (3%+ Yield)
• Undervalued Small Caps with Insider Buying
• High growth Tech and AI Companies
Or build your own from over 50 metrics.
Have feedback on this article? Concerned about the content? Get in touch with us directly. Alternatively, email editorial-team (at) simplywallst.com.
This article by Simply Wall St is general in nature. We provide commentary based on historical data and analyst forecasts only using an unbiased methodology and our articles are not intended to be financial advice. It does not constitute a recommendation to buy or sell any stock, and does not take account of your objectives, or your financial situation. We aim to bring you long-term focused analysis driven by fundamental data. Note that our analysis may not factor in the latest price-sensitive company announcements or qualitative material. Simply Wall St has no position in any stocks mentioned.
About NYSE:XYL
Xylem
Engages in the design, manufacture, and servicing of engineered products and solutions for utility, industrial, and residential and commercial building services settings worldwide.
Flawless balance sheet with proven track record and pays a dividend.
Similar Companies
Market Insights

Advertisement
Community Narratives
America Wants Homegrown Drones — Draganfly Is Ready to Deliver
Fair Value US$9.21|33.8% undervalued
JO
Community Contributor
Cheesecake Factory offers an enticing opportunity for long-term growth by leveraging new concepts
Fair Value US$73.83|26.3% undervalued
ZW
Community Contributor
Coca-Cola’s Intrinsic Value Set to Rise with Fed Rate Cut
Fair Value US$67.50|1.2% undervalued
AL
Community Contributor
Fully Permitted Gold Mine with 50 Baggers Potential 
Fair Value CA$41.00|98.6% undervalued
RO
Community Contributor