- United States
- /
- Electrical
- /
- NYSE:WBX
Not Many Are Piling Into Wallbox N.V. (NYSE:WBX) Stock Yet As It Plummets 25%
Unfortunately for some shareholders, the Wallbox N.V. (NYSE:WBX) share price has dived 25% in the last thirty days, prolonging recent pain. The drop over the last 30 days has capped off a tough year for shareholders, with the share price down 37% in that time.
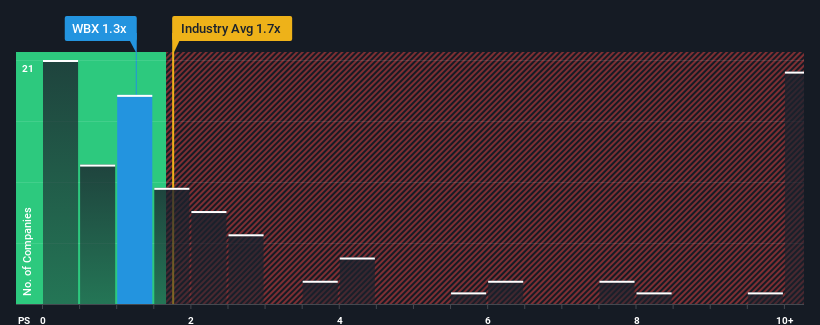
Following the heavy fall in price, Wallbox may be sending buy signals at present with its price-to-sales (or "P/S") ratio of 1.3x, considering almost half of all companies in the Electrical industry in the United States have P/S ratios greater than 1.8x and even P/S higher than 5x aren't out of the ordinary. However, the P/S might be low for a reason and it requires further investigation to determine if it's justified.
View our latest analysis for Wallbox

What Does Wallbox's P/S Mean For Shareholders?
Wallbox certainly has been doing a good job lately as it's been growing revenue more than most other companies. One possibility is that the P/S ratio is low because investors think this strong revenue performance might be less impressive moving forward. If the company manages to stay the course, then investors should be rewarded with a share price that matches its revenue figures.
If you'd like to see what analysts are forecasting going forward, you should check out our free report on Wallbox.How Is Wallbox's Revenue Growth Trending?
There's an inherent assumption that a company should underperform the industry for P/S ratios like Wallbox's to be considered reasonable.
Retrospectively, the last year delivered an exceptional 16% gain to the company's top line. The latest three year period has also seen an incredible overall rise in revenue, aided by its incredible short-term performance. Therefore, it's fair to say the revenue growth recently has been superb for the company.
Turning to the outlook, the next three years should generate growth of 43% per annum as estimated by the four analysts watching the company. That's shaping up to be materially higher than the 29% per annum growth forecast for the broader industry.
With this information, we find it odd that Wallbox is trading at a P/S lower than the industry. Apparently some shareholders are doubtful of the forecasts and have been accepting significantly lower selling prices.
The Final Word
The southerly movements of Wallbox's shares means its P/S is now sitting at a pretty low level. Using the price-to-sales ratio alone to determine if you should sell your stock isn't sensible, however it can be a practical guide to the company's future prospects.
To us, it seems Wallbox currently trades on a significantly depressed P/S given its forecasted revenue growth is higher than the rest of its industry. There could be some major risk factors that are placing downward pressure on the P/S ratio. At least price risks look to be very low, but investors seem to think future revenues could see a lot of volatility.
Don't forget that there may be other risks. For instance, we've identified 2 warning signs for Wallbox that you should be aware of.
Of course, profitable companies with a history of great earnings growth are generally safer bets. So you may wish to see this free collection of other companies that have reasonable P/E ratios and have grown earnings strongly.
Valuation is complex, but we're here to simplify it.
Discover if Wallbox might be undervalued or overvalued with our detailed analysis, featuring fair value estimates, potential risks, dividends, insider trades, and its financial condition.
Access Free AnalysisHave feedback on this article? Concerned about the content? Get in touch with us directly. Alternatively, email editorial-team (at) simplywallst.com.
This article by Simply Wall St is general in nature. We provide commentary based on historical data and analyst forecasts only using an unbiased methodology and our articles are not intended to be financial advice. It does not constitute a recommendation to buy or sell any stock, and does not take account of your objectives, or your financial situation. We aim to bring you long-term focused analysis driven by fundamental data. Note that our analysis may not factor in the latest price-sensitive company announcements or qualitative material. Simply Wall St has no position in any stocks mentioned.
About NYSE:WBX
Wallbox
A technology company, designs, manufactures, and distributes charging solutions for residential, business, and public applications in Europe, the Middle East, Asia, North America, and the Asia Pacific.
High growth potential and fair value.
Similar Companies
Market Insights
Community Narratives


