- United States
- /
- Machinery
- /
- NYSE:TRN
We Think The Compensation For Trinity Industries, Inc.'s (NYSE:TRN) CEO Looks About Right


Key Insights
- Trinity Industries' Annual General Meeting to take place on 20th of May
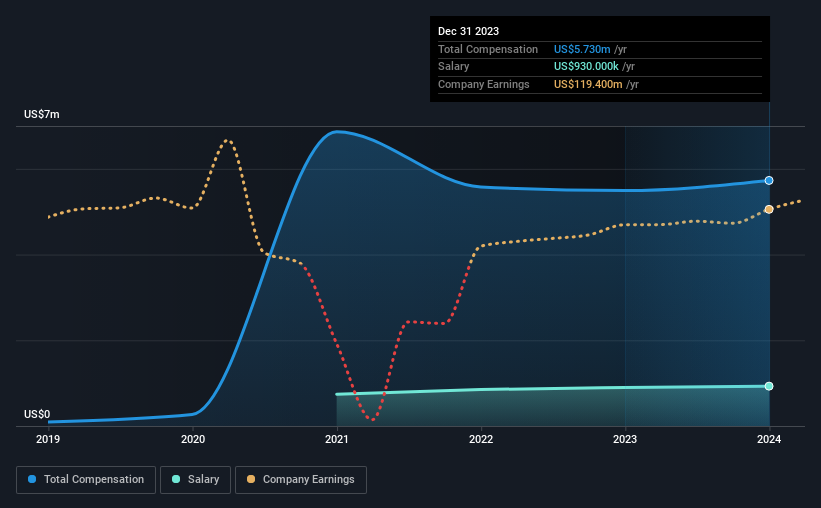
- Total pay for CEO E. Savage includes US$930.0k salary
- The total compensation is similar to the average for the industry
- Trinity Industries' total shareholder return over the past three years was 23% while its EPS grew by 102% over the past three years
Under the guidance of CEO E. Savage, Trinity Industries, Inc. (NYSE:TRN) has performed reasonably well recently. This is something shareholders will keep in mind as they cast their votes on company resolutions such as executive remuneration in the upcoming AGM on 20th of May. Based on our analysis of the data below, we think CEO compensation seems reasonable for now.
View our latest analysis for Trinity Industries
Comparing Trinity Industries, Inc.'s CEO Compensation With The Industry
Our data indicates that Trinity Industries, Inc. has a market capitalization of US$2.5b, and total annual CEO compensation was reported as US$5.7m for the year to December 2023. That's a fairly small increase of 4.3% over the previous year. We think total compensation is more important but our data shows that the CEO salary is lower, at US$930k.
On examining similar-sized companies in the American Machinery industry with market capitalizations between US$2.0b and US$6.4b, we discovered that the median CEO total compensation of that group was US$6.1m. So it looks like Trinity Industries compensates E. Savage in line with the median for the industry. Furthermore, E. Savage directly owns US$14m worth of shares in the company, implying that they are deeply invested in the company's success.
| Component | 2023 | 2022 | Proportion (2023) |
| Salary | US$930k | US$900k | 16% |
| Other | US$4.8m | US$4.6m | 84% |
| Total Compensation | US$5.7m | US$5.5m | 100% |
On an industry level, around 15% of total compensation represents salary and 85% is other remuneration. Trinity Industries is largely mirroring the industry average when it comes to the share a salary enjoys in overall compensation. If non-salary compensation dominates total pay, it's an indicator that the executive's salary is tied to company performance.
A Look at Trinity Industries, Inc.'s Growth Numbers
Trinity Industries, Inc.'s earnings per share (EPS) grew 102% per year over the last three years. It achieved revenue growth of 47% over the last year.
Shareholders would be glad to know that the company has improved itself over the last few years. Most shareholders would be pleased to see strong revenue growth combined with EPS growth. This combo suggests a fast growing business. Historical performance can sometimes be a good indicator on what's coming up next but if you want to peer into the company's future you might be interested in this free visualization of analyst forecasts.
Has Trinity Industries, Inc. Been A Good Investment?
Trinity Industries, Inc. has served shareholders reasonably well, with a total return of 23% over three years. But they would probably prefer not to see CEO compensation far in excess of the median.
To Conclude...
Seeing that the company has put up a decent performance, only a few shareholders, if any at all, might have questions about the CEO pay in the upcoming AGM. Despite the pleasing results, we still think that any proposed increases to CEO compensation will be examined based on a case by case basis and linked to performance outcomes.
CEO compensation is an important area to keep your eyes on, but we've also need to pay attention to other attributes of the company. We did our research and identified 4 warning signs (and 1 which is a bit unpleasant) in Trinity Industries we think you should know about.
Arguably, business quality is much more important than CEO compensation levels. So check out this free list of interesting companies that have HIGH return on equity and low debt.
Valuation is complex, but we're here to simplify it.
Discover if Trinity Industries might be undervalued or overvalued with our detailed analysis, featuring fair value estimates, potential risks, dividends, insider trades, and its financial condition.
Access Free AnalysisHave feedback on this article? Concerned about the content? Get in touch with us directly. Alternatively, email editorial-team (at) simplywallst.com.
This article by Simply Wall St is general in nature. We provide commentary based on historical data and analyst forecasts only using an unbiased methodology and our articles are not intended to be financial advice. It does not constitute a recommendation to buy or sell any stock, and does not take account of your objectives, or your financial situation. We aim to bring you long-term focused analysis driven by fundamental data. Note that our analysis may not factor in the latest price-sensitive company announcements or qualitative material. Simply Wall St has no position in any stocks mentioned.
About NYSE:TRN
Trinity Industries
Provides rail transportation products and services under the TrinityRail name in North America.
Proven track record average dividend payer.
Market Insights

Community Narratives
