Advertisement
- United States
- /
- Aerospace & Defense
- /
- NYSE:RTX
Assessing RTX Stock After Pentagon Pushes Missile Makers to Double Production in 2025

Simply Wall St
Reviewed by Bailey Pemberton
If you are holding RTX stock or thinking of jumping in, you are not alone in watching these defense industry giants with curiosity right now. RTX has definitely given its shareholders something to talk about, with its price up nearly 193% in the last five years and a 95.6% surge over three years. Even in the past year, the company has turned in a 30% gain. Recently, though, things have gotten a bit choppier. The stock is down 5.8% this past week, but still up 2.3% over the last month. This tug-of-war between longer-term growth and short-term bumps is catching the eye of investors everywhere.
Why the volatility? When the Pentagon asks missile suppliers to dramatically ramp up production, investors take notice. RTX, as a major contractor, has been swept up in renewed attention thanks to both missile supply chain headlines and broader global tensions. On top of that, cyberattacks on critical airport software and heightened military meetings create an undercurrent of both risk and opportunity for companies in this space.
So, what does all this mean for RTX’s actual value right now? Their latest valuation score is 1 out of 6, suggesting the company is undervalued in only one major metric. Does that mean RTX is on the expensive side, or do the headlines and long-term performance reveal a deeper story? Let’s dig into the different ways to size up RTX’s value. Stick around, because there is an even smarter approach to valuation we will cover at the end.
RTX scores just 1/6 on our valuation checks. See what other red flags we found in the full valuation breakdown.
Approach 1: RTX Discounted Cash Flow (DCF) Analysis
The Discounted Cash Flow (DCF) model estimates what a stock should be worth by projecting future cash flows, in this case RTX's Free Cash Flow, and discounting them back to today's value using a calculated rate. This helps investors get a sense of whether they are paying a fair price for RTX compared to estimated future earnings.
Currently, RTX reports Free Cash Flow of about $2.4 billion. Analyst forecasts suggest this figure may surge to over $10.6 billion by 2029. Only the first five years are based on direct analyst estimates, with the remaining years extrapolated using industry models. Simply Wall St’s approach extends these forecasts through 2035 to better gauge the business’s long-term earning potential, all in US dollars ($).
After crunching these numbers, the DCF model values RTX shares at $131.32 each. However, this is roughly 21.4% above the current market price, which suggests that RTX stock is trading at a premium to its underlying cash flows according to this model.
Result: OVERVALUED
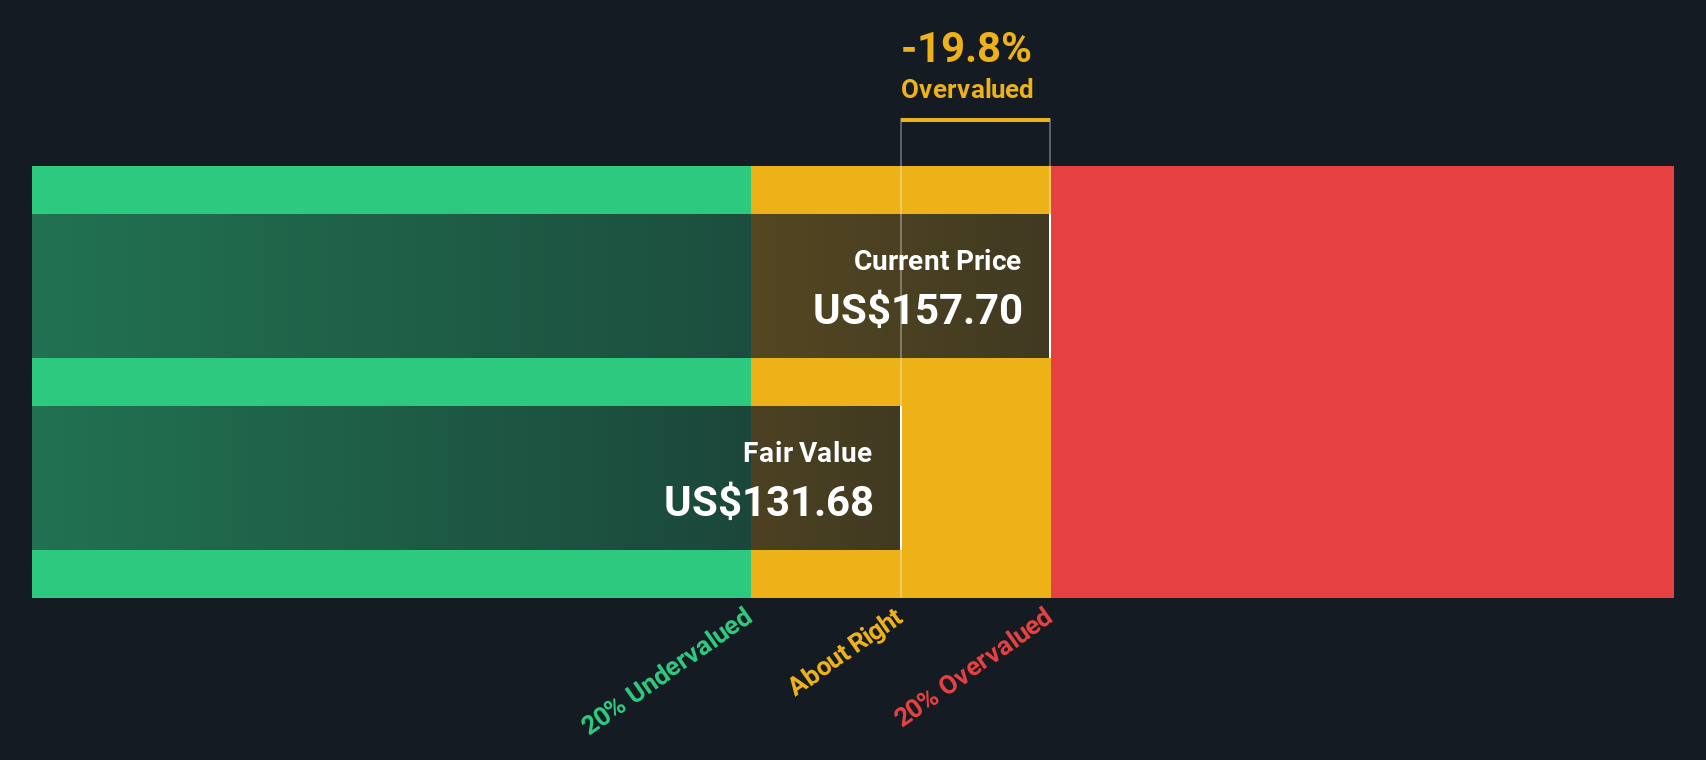
Our Discounted Cash Flow (DCF) analysis suggests RTX may be overvalued by 21.4%. Find undervalued stocks or create your own screener to find better value opportunities.
Approach 2: RTX Price vs Earnings (PE Ratio)
The Price-to-Earnings (PE) ratio is a widely used metric for valuing profitable companies like RTX, because it directly compares a company’s current share price to its earnings per share. It offers investors a snapshot of how much the market is willing to pay today for a dollar of RTX’s earnings. In general, higher growth companies tend to trade at higher PE ratios, while riskier or slower growing businesses trade at a discount, so understanding RTX’s growth outlook is key to interpreting this number.
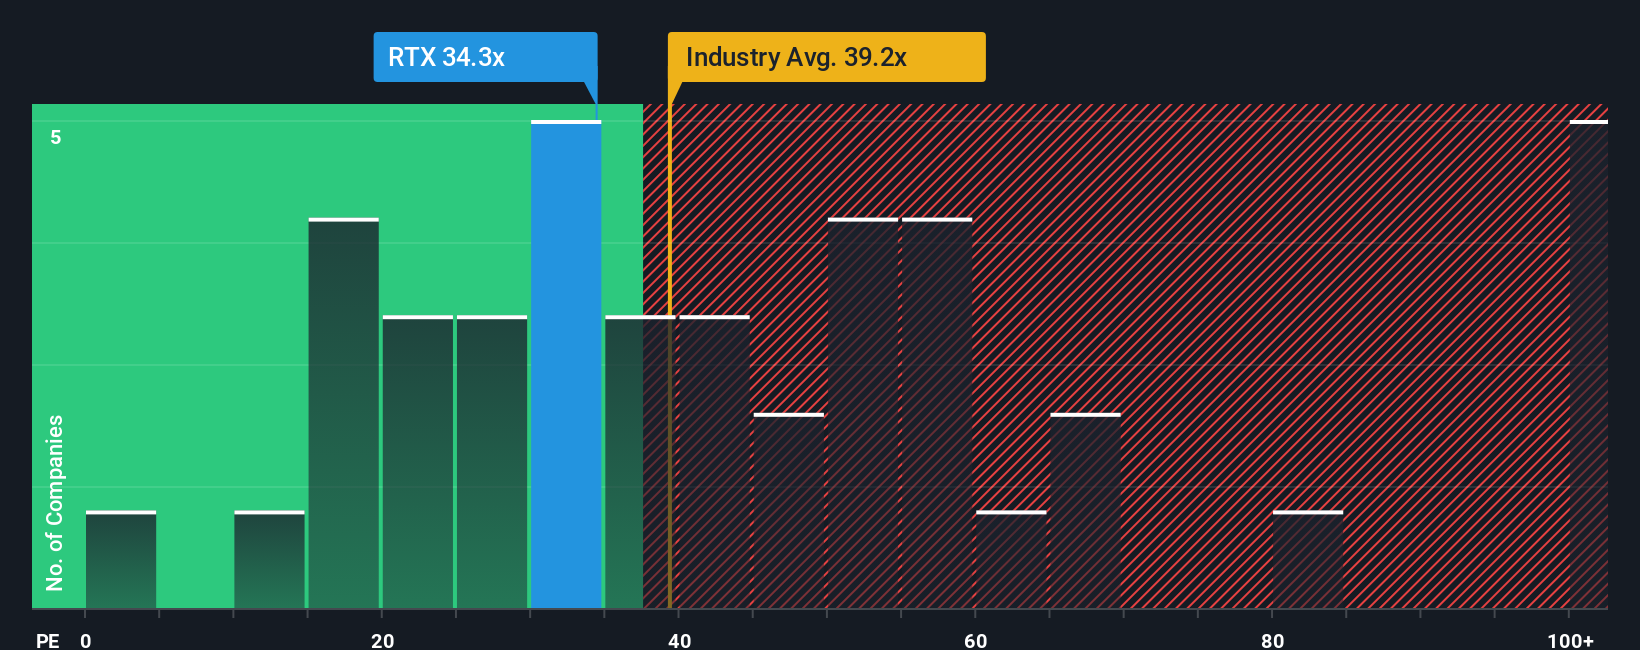
RTX currently trades at a PE ratio of 34.7x. How does that stack up? The average PE of RTX’s Aerospace & Defense industry peers is 40.0x, and its closest competitors average 28.7x, placing RTX in the middle of the pack. Simply Wall St also calculates what’s called the “Fair Ratio.” For RTX, it stands at 33.6x. This figure is tailored to RTX specifically, taking into account factors like its earnings growth potential, profit margins, overall market risks, and company size. That makes it a better benchmark than plain industry or peer averages, which do not reflect RTX’s unique business dynamics.
Given RTX’s actual PE ratio of 34.7x is extremely close to the Fair Ratio of 33.6x, the stock appears to be reasonably valued according to this method, not meaningfully expensive or cheap.
Result: ABOUT RIGHT
PE ratios tell one story, but what if the real opportunity lies elsewhere? Discover companies where insiders are betting big on explosive growth.
Upgrade Your Decision Making: Choose your RTX Narrative
Earlier, we mentioned that there is an even better way to understand valuation, so let's introduce you to Narratives. A Narrative is your personal investment story for a company like RTX, connecting the events and outlook you believe in with realistic forecasts for things like revenue, earnings, and profit margins. Ultimately, this shapes what you think the stock is actually worth.
Narratives go beyond the raw numbers by making you articulate why you think RTX will perform a certain way, linking your big-picture view to a fair value and helping you clearly see if the current price presents a buy or sell opportunity. They are simple and intuitive tools, available directly on Simply Wall St's Community page, where millions of investors share and update their perspectives every day.
What makes Narratives so useful is that they update automatically when fresh news, earnings results, or breaking developments emerge, letting you continually sense-check your assumptions. For example, some RTX investors may build a bullish Narrative, expecting strong global defense spending will push prices over $180, while others craft a more cautious Narrative with a fair value around $134 due to risks from tariffs and cost overruns.
Do you think there's more to the story for RTX? Create your own Narrative to let the Community know!
This article by Simply Wall St is general in nature. We provide commentary based on historical data and analyst forecasts only using an unbiased methodology and our articles are not intended to be financial advice. It does not constitute a recommendation to buy or sell any stock, and does not take account of your objectives, or your financial situation. We aim to bring you long-term focused analysis driven by fundamental data. Note that our analysis may not factor in the latest price-sensitive company announcements or qualitative material. Simply Wall St has no position in any stocks mentioned.
New: AI Stock Screener & Alerts
Our new AI Stock Screener scans the market every day to uncover opportunities.
• Dividend Powerhouses (3%+ Yield)
• Undervalued Small Caps with Insider Buying
• High growth Tech and AI Companies
Or build your own from over 50 metrics.
Have feedback on this article? Concerned about the content? Get in touch with us directly. Alternatively, email editorial-team@simplywallst.com
About NYSE:RTX
RTX
An aerospace and defense company, provides systems and services for the commercial, military, and government customers in the United States and internationally.
Solid track record with mediocre balance sheet.
Similar Companies
Market Insights

Advertisement
Community Narratives
A formidable player in AI and enterprise computing.
Fair Value US$210.00|3.9% overvalued
CO
Community Contributor
IREN's Bold Moves in Sustainable Bitcoin Mining & AI Data Centers
Fair Value US$89.00|21.8% undervalued
BL
Community Contributor
Cooling the Champions: The Aussie Tech Behind F1's Victories
Fair Value AU$12.40|39.4% undervalued
TR
Community Contributor