
Advertisement
Was Jacobs Engineering Group Inc.'s (NYSE:JEC) Earnings Growth Better Than The Industry's?

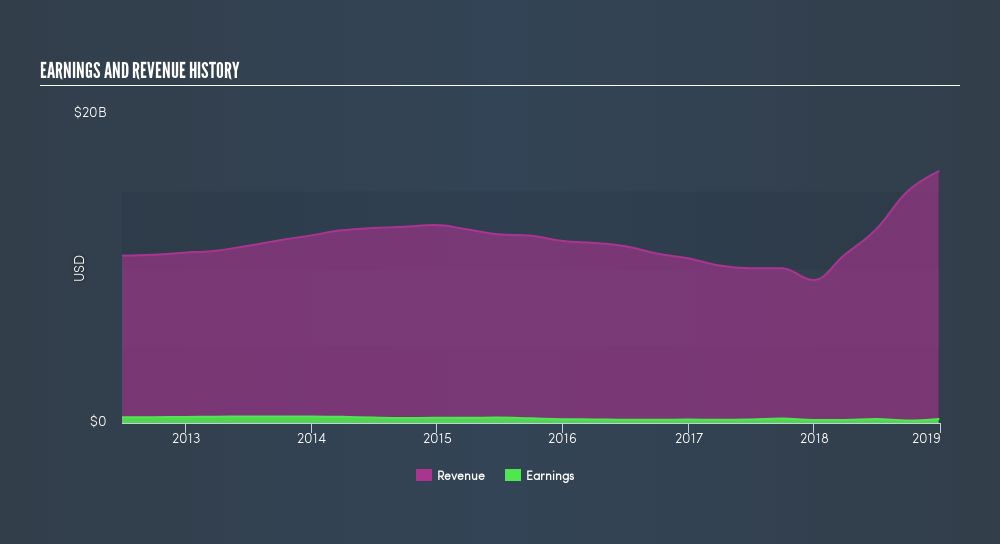
When Jacobs Engineering Group Inc. (NYSE:JEC) released its most recent earnings update (28 December 2018), I compared it against two factor: its historical earnings track record, and the performance of its industry peers on average. Understanding how Jacobs Engineering Group performed requires a benchmark rather than trying to assess a standalone number at one point in time. Below is a quick commentary on how I see JEC has performed.
See our latest analysis for Jacobs Engineering Group
Could JEC beat the long-term trend and outperform its industry?
JEC's trailing twelve-month earnings (from 28 December 2018) of US$262m has jumped 33% compared to the previous year.
Furthermore, this one-year growth rate has exceeded its 5-year annual growth average of -14%, indicating the rate at which JEC is growing has accelerated. What's enabled this growth? Let's see if it is solely due to industry tailwinds, or if Jacobs Engineering Group has experienced some company-specific growth.
In terms of returns from investment, Jacobs Engineering Group has fallen short of achieving a 20% return on equity (ROE), recording 4.7% instead. Furthermore, its return on assets (ROA) of 2.7% is below the US Construction industry of 5.5%, indicating Jacobs Engineering Group's are utilized less efficiently. And finally, its return on capital (ROC), which also accounts for Jacobs Engineering Group’s debt level, has declined over the past 3 years from 9.8% to 7.7%. This correlates with an increase in debt holding, with debt-to-equity ratio rising from 25% to 46% over the past 5 years.
What does this mean?
While past data is useful, it doesn’t tell the whole story. Recent positive growth isn't always indicative of a continued optimistic outlook. I suggest you continue to research Jacobs Engineering Group to get a more holistic view of the stock by looking at:
- Future Outlook: What are well-informed industry analysts predicting for JEC’s future growth? Take a look at our free research report of analyst consensus for JEC’s outlook.
- Financial Health: Are JEC’s operations financially sustainable? Balance sheets can be hard to analyze, which is why we’ve done it for you. Check out our financial health checks here.
- Other High-Performing Stocks: Are there other stocks that provide better prospects with proven track records? Explore our free list of these great stocks here.
NB: Figures in this article are calculated using data from the trailing twelve months from 28 December 2018. This may not be consistent with full year annual report figures.
We aim to bring you long-term focused research analysis driven by fundamental data. Note that our analysis may not factor in the latest price-sensitive company announcements or qualitative material.
If you spot an error that warrants correction, please contact the editor at editorial-team@simplywallst.com. This article by Simply Wall St is general in nature. It does not constitute a recommendation to buy or sell any stock, and does not take account of your objectives, or your financial situation. Simply Wall St has no position in the stocks mentioned. Thank you for reading.
About NYSE:J
Jacobs Solutions
Engages in the infrastructure and advanced facilities, and consulting businesses in the United States, Europe, Canada, India, Asia, Australia, New Zealand, the Middle East, and Africa.
Excellent balance sheet with proven track record.
Similar Companies
Market Insights

Advertisement
Community Narratives
Pinterest will surge as advertising innovations ignite revenue growth
Fair Value US$42.63|26.3% undervalued
BR
Community Contributor
Brambles' Revenue Set to Climb 14% with Profit Margins Following
Fair Value AU$21.90|4.9% overvalued
RO
Community Contributor
Challenging Future for STG as Organic Sales Decline by 8.8%
Fair Value DKK 116.13|26.8% undervalued
KA
Community Contributor