Update: Jacobs Engineering Group (NYSE:JEC) Stock Gained 52% In The Last Three Years


Want to participate in a short research study? Help shape the future of investing tools and you could win a $250 gift card!
By buying an index fund, investors can approximate the average market return. But if you choose individual stocks with prowess, you can make superior returns. For example, the Jacobs Engineering Group Inc. (NYSE:JEC) share price is up 52% in the last three years, clearly besting than the market return of around 31% (not including dividends). However, more recent returns haven't been as impressive as that, with the stock returning just 20% in the last year, including dividends.
See our latest analysis for Jacobs Engineering Group
While markets are a powerful pricing mechanism, share prices reflect investor sentiment, not just underlying business performance. One imperfect but simple way to consider how the market perception of a company has shifted is to compare the change in the earnings per share (EPS) with the share price movement.
During three years of share price growth, Jacobs Engineering Group achieved compound earnings per share growth of 12% per year. We note that the 15% yearly (average) share price gain isn't too far from the EPS growth rate. Coincidence? Probably not. This observation indicates that the market's attitude to the business hasn't changed all that much. Rather, the share price has approximately tracked EPS growth.
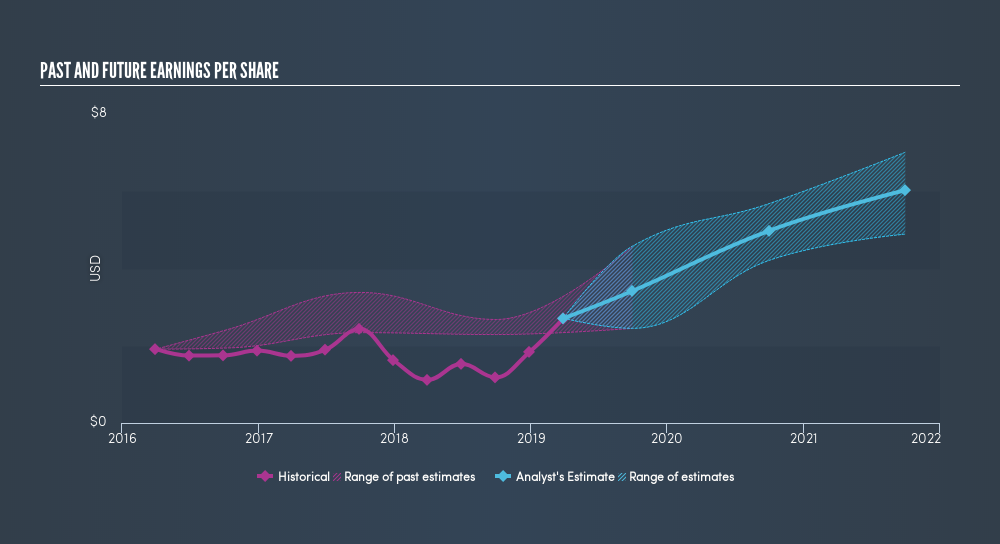
You can see how EPS has changed over time in the image below (click on the chart to see the exact values).
We know that Jacobs Engineering Group has improved its bottom line lately, but is it going to grow revenue? This free report showing analyst revenue forecasts should help you figure out if the EPS growth can be sustained.
What About Dividends?
When looking at investment returns, it is important to consider the difference between total shareholder return (TSR) and share price return. The TSR incorporates the value of any spin-offs or discounted capital raisings, along with any dividends, based on the assumption that the dividends are reinvested. It's fair to say that the TSR gives a more complete picture for stocks that pay a dividend. We note that for Jacobs Engineering Group the TSR over the last 3 years was 56%, which is better than the share price return mentioned above. And there's no prize for guessing that the dividend payments largely explain the divergence!
A Different Perspective
It's good to see that Jacobs Engineering Group has rewarded shareholders with a total shareholder return of 20% in the last twelve months. Of course, that includes the dividend. That gain is better than the annual TSR over five years, which is 7.5%. Therefore it seems like sentiment around the company has been positive lately. Someone with an optimistic perspective could view the recent improvement in TSR as indicating that the business itself is getting better with time. Before spending more time on Jacobs Engineering Group it might be wise to click here to see if insiders have been buying or selling shares.
Of course Jacobs Engineering Group may not be the best stock to buy. So you may wish to see this free collection of growth stocks.
Please note, the market returns quoted in this article reflect the market weighted average returns of stocks that currently trade on US exchanges.
We aim to bring you long-term focused research analysis driven by fundamental data. Note that our analysis may not factor in the latest price-sensitive company announcements or qualitative material.
If you spot an error that warrants correction, please contact the editor at editorial-team@simplywallst.com. This article by Simply Wall St is general in nature. It does not constitute a recommendation to buy or sell any stock, and does not take account of your objectives, or your financial situation. Simply Wall St has no position in the stocks mentioned. Thank you for reading.
About NYSE:J
Jacobs Solutions
Engages in the infrastructure and advanced facilities, and consulting businesses in the United States, Europe, Canada, India, Asia, Australia, New Zealand, the Middle East, and Africa.
Excellent balance sheet with reasonable growth potential.
Similar Companies
Market Insights

Community Narratives


