- United States
- /
- Machinery
- /
- NYSE:GTLS
Chart Industries (NYSE:GTLS) Is Doing The Right Things To Multiply Its Share Price


There are a few key trends to look for if we want to identify the next multi-bagger. Typically, we'll want to notice a trend of growing return on capital employed (ROCE) and alongside that, an expanding base of capital employed. This shows us that it's a compounding machine, able to continually reinvest its earnings back into the business and generate higher returns. So when we looked at Chart Industries (NYSE:GTLS) and its trend of ROCE, we really liked what we saw.
What Is Return On Capital Employed (ROCE)?
If you haven't worked with ROCE before, it measures the 'return' (pre-tax profit) a company generates from capital employed in its business. Analysts use this formula to calculate it for Chart Industries:
Return on Capital Employed = Earnings Before Interest and Tax (EBIT) ÷ (Total Assets - Current Liabilities)
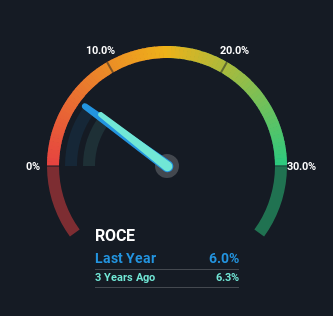
0.06 = US$434m ÷ (US$9.1b - US$1.9b) (Based on the trailing twelve months to December 2023).
So, Chart Industries has an ROCE of 6.0%. In absolute terms, that's a low return and it also under-performs the Machinery industry average of 13%.
View our latest analysis for Chart Industries
In the above chart we have measured Chart Industries' prior ROCE against its prior performance, but the future is arguably more important. If you're interested, you can view the analysts predictions in our free analyst report for Chart Industries .
What The Trend Of ROCE Can Tell Us
We're glad to see that ROCE is heading in the right direction, even if it is still low at the moment. Over the last five years, returns on capital employed have risen substantially to 6.0%. The amount of capital employed has increased too, by 373%. The increasing returns on a growing amount of capital is common amongst multi-baggers and that's why we're impressed.
The Bottom Line On Chart Industries' ROCE
All in all, it's terrific to see that Chart Industries is reaping the rewards from prior investments and is growing its capital base. And with a respectable 77% awarded to those who held the stock over the last five years, you could argue that these developments are starting to get the attention they deserve. In light of that, we think it's worth looking further into this stock because if Chart Industries can keep these trends up, it could have a bright future ahead.
One final note, you should learn about the 3 warning signs we've spotted with Chart Industries (including 1 which is potentially serious) .
For those who like to invest in solid companies, check out this free list of companies with solid balance sheets and high returns on equity.
If you're looking to trade Chart Industries, open an account with the lowest-cost platform trusted by professionals, Interactive Brokers.
With clients in over 200 countries and territories, and access to 160 markets, IBKR lets you trade stocks, options, futures, forex, bonds and funds from a single integrated account.
Enjoy no hidden fees, no account minimums, and FX conversion rates as low as 0.03%, far better than what most brokers offer.
Sponsored ContentNew: AI Stock Screener & Alerts
Our new AI Stock Screener scans the market every day to uncover opportunities.
• Dividend Powerhouses (3%+ Yield)
• Undervalued Small Caps with Insider Buying
• High growth Tech and AI Companies
Or build your own from over 50 metrics.
Have feedback on this article? Concerned about the content? Get in touch with us directly. Alternatively, email editorial-team (at) simplywallst.com.
This article by Simply Wall St is general in nature. We provide commentary based on historical data and analyst forecasts only using an unbiased methodology and our articles are not intended to be financial advice. It does not constitute a recommendation to buy or sell any stock, and does not take account of your objectives, or your financial situation. We aim to bring you long-term focused analysis driven by fundamental data. Note that our analysis may not factor in the latest price-sensitive company announcements or qualitative material. Simply Wall St has no position in any stocks mentioned.
About NYSE:GTLS
Chart Industries
Engages in the designing, engineering, and manufacturing of process technologies and equipment for the gas and liquid molecules in the United States and internationally.
Solid track record and fair value.

