- United States
- /
- Machinery
- /
- NYSE:GTLS
Chart Industries' (NYSE:GTLS) 28% CAGR outpaced the company's earnings growth over the same five-year period


When you buy a stock there is always a possibility that it could drop 100%. But on a lighter note, a good company can see its share price rise well over 100%. One great example is Chart Industries, Inc. (NYSE:GTLS) which saw its share price drive 243% higher over five years. Also pleasing for shareholders was the 42% gain in the last three months.
The past week has proven to be lucrative for Chart Industries investors, so let's see if fundamentals drove the company's five-year performance.
Check out our latest analysis for Chart Industries
In his essay The Superinvestors of Graham-and-Doddsville Warren Buffett described how share prices do not always rationally reflect the value of a business. By comparing earnings per share (EPS) and share price changes over time, we can get a feel for how investor attitudes to a company have morphed over time.
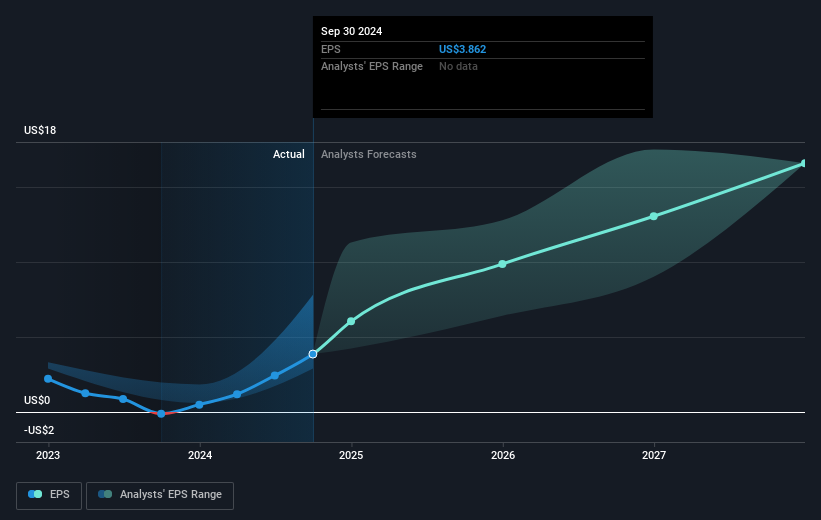
During the five years of share price growth, Chart Industries moved from a loss to profitability. That kind of transition can be an inflection point that justifies a strong share price gain, just as we have seen here.
The image below shows how EPS has tracked over time (if you click on the image you can see greater detail).
We consider it positive that insiders have made significant purchases in the last year. Even so, future earnings will be far more important to whether current shareholders make money. This free interactive report on Chart Industries' earnings, revenue and cash flow is a great place to start, if you want to investigate the stock further.
A Different Perspective
It's nice to see that Chart Industries shareholders have received a total shareholder return of 81% over the last year. That's better than the annualised return of 28% over half a decade, implying that the company is doing better recently. Someone with an optimistic perspective could view the recent improvement in TSR as indicating that the business itself is getting better with time. While it is well worth considering the different impacts that market conditions can have on the share price, there are other factors that are even more important. Consider for instance, the ever-present spectre of investment risk. We've identified 1 warning sign with Chart Industries , and understanding them should be part of your investment process.
If you like to buy stocks alongside management, then you might just love this free list of companies. (Hint: most of them are flying under the radar).
Please note, the market returns quoted in this article reflect the market weighted average returns of stocks that currently trade on American exchanges.
New: AI Stock Screener & Alerts
Our new AI Stock Screener scans the market every day to uncover opportunities.
• Dividend Powerhouses (3%+ Yield)
• Undervalued Small Caps with Insider Buying
• High growth Tech and AI Companies
Or build your own from over 50 metrics.
Have feedback on this article? Concerned about the content? Get in touch with us directly. Alternatively, email editorial-team (at) simplywallst.com.
This article by Simply Wall St is general in nature. We provide commentary based on historical data and analyst forecasts only using an unbiased methodology and our articles are not intended to be financial advice. It does not constitute a recommendation to buy or sell any stock, and does not take account of your objectives, or your financial situation. We aim to bring you long-term focused analysis driven by fundamental data. Note that our analysis may not factor in the latest price-sensitive company announcements or qualitative material. Simply Wall St has no position in any stocks mentioned.
About NYSE:GTLS
Chart Industries
Engages in the designing, engineering, and manufacturing of process technologies and equipment for the gas and liquid molecules in the United States and internationally.
Moderate growth potential with acceptable track record.
Similar Companies
Market Insights

Community Narratives
