
Advertisement
- United States
- /
- Machinery
- /
- NYSE:GGG
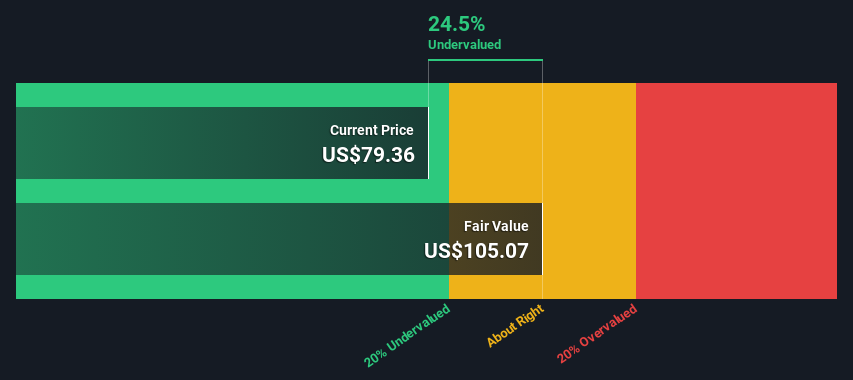
An Intrinsic Calculation For Graco Inc. (NYSE:GGG) Suggests It's 24% Undervalued

Key Insights
- Graco's estimated fair value is US$105 based on 2 Stage Free Cash Flow to Equity
- Graco is estimated to be 24% undervalued based on current share price of US$79.36
- Our fair value estimate is 19% higher than Graco's analyst price target of US$88.03
Today we'll do a simple run through of a valuation method used to estimate the attractiveness of Graco Inc. (NYSE:GGG) as an investment opportunity by estimating the company's future cash flows and discounting them to their present value. We will use the Discounted Cash Flow (DCF) model on this occasion. Before you think you won't be able to understand it, just read on! It's actually much less complex than you'd imagine.
We would caution that there are many ways of valuing a company and, like the DCF, each technique has advantages and disadvantages in certain scenarios. If you want to learn more about discounted cash flow, the rationale behind this calculation can be read in detail in the Simply Wall St analysis model.
See our latest analysis for Graco
What's The Estimated Valuation?
We are going to use a two-stage DCF model, which, as the name states, takes into account two stages of growth. The first stage is generally a higher growth period which levels off heading towards the terminal value, captured in the second 'steady growth' period. To start off with, we need to estimate the next ten years of cash flows. Where possible we use analyst estimates, but when these aren't available we extrapolate the previous free cash flow (FCF) from the last estimate or reported value. We assume companies with shrinking free cash flow will slow their rate of shrinkage, and that companies with growing free cash flow will see their growth rate slow, over this period. We do this to reflect that growth tends to slow more in the early years than it does in later years.
Generally we assume that a dollar today is more valuable than a dollar in the future, so we need to discount the sum of these future cash flows to arrive at a present value estimate:
10-year free cash flow (FCF) forecast
| 2024 | 2025 | 2026 | 2027 | 2028 | 2029 | 2030 | 2031 | 2032 | 2033 | |
| Levered FCF ($, Millions) | US$538.1m | US$572.1m | US$634.3m | US$726.0m | US$820.0m | US$889.9m | US$949.4m | US$1.00b | US$1.05b | US$1.09b |
| Growth Rate Estimate Source | Analyst x6 | Analyst x8 | Analyst x4 | Analyst x1 | Analyst x1 | Est @ 8.53% | Est @ 6.68% | Est @ 5.39% | Est @ 4.49% | Est @ 3.86% |
| Present Value ($, Millions) Discounted @ 7.0% | US$503 | US$500 | US$518 | US$554 | US$585 | US$593 | US$591 | US$582 | US$569 | US$552 |
("Est" = FCF growth rate estimated by Simply Wall St)
Present Value of 10-year Cash Flow (PVCF) = US$5.5b
After calculating the present value of future cash flows in the initial 10-year period, we need to calculate the Terminal Value, which accounts for all future cash flows beyond the first stage. For a number of reasons a very conservative growth rate is used that cannot exceed that of a country's GDP growth. In this case we have used the 5-year average of the 10-year government bond yield (2.4%) to estimate future growth. In the same way as with the 10-year 'growth' period, we discount future cash flows to today's value, using a cost of equity of 7.0%.
Terminal Value (TV)= FCF2033 × (1 + g) ÷ (r – g) = US$1.1b× (1 + 2.4%) ÷ (7.0%– 2.4%) = US$24b
Present Value of Terminal Value (PVTV)= TV / (1 + r)10= US$24b÷ ( 1 + 7.0%)10= US$12b
The total value is the sum of cash flows for the next ten years plus the discounted terminal value, which results in the Total Equity Value, which in this case is US$18b. To get the intrinsic value per share, we divide this by the total number of shares outstanding. Compared to the current share price of US$79.4, the company appears a touch undervalued at a 24% discount to where the stock price trades currently. Remember though, that this is just an approximate valuation, and like any complex formula - garbage in, garbage out.
The Assumptions
The calculation above is very dependent on two assumptions. The first is the discount rate and the other is the cash flows. Part of investing is coming up with your own evaluation of a company's future performance, so try the calculation yourself and check your own assumptions. The DCF also does not consider the possible cyclicality of an industry, or a company's future capital requirements, so it does not give a full picture of a company's potential performance. Given that we are looking at Graco as potential shareholders, the cost of equity is used as the discount rate, rather than the cost of capital (or weighted average cost of capital, WACC) which accounts for debt. In this calculation we've used 7.0%, which is based on a levered beta of 1.005. Beta is a measure of a stock's volatility, compared to the market as a whole. We get our beta from the industry average beta of globally comparable companies, with an imposed limit between 0.8 and 2.0, which is a reasonable range for a stable business.
SWOT Analysis for Graco
Strength
- Debt is not viewed as a risk.
- Dividends are covered by earnings and cash flows.
Weakness
- Earnings growth over the past year underperformed the Machinery industry.
- Dividend is low compared to the top 25% of dividend payers in the Machinery market.
Opportunity
- Annual earnings are forecast to grow for the next 3 years.
- Trading below our estimate of fair value by more than 20%.
Threat
- Annual earnings are forecast to grow slower than the American market.
Moving On:
Valuation is only one side of the coin in terms of building your investment thesis, and it is only one of many factors that you need to assess for a company. The DCF model is not a perfect stock valuation tool. Rather it should be seen as a guide to "what assumptions need to be true for this stock to be under/overvalued?" For instance, if the terminal value growth rate is adjusted slightly, it can dramatically alter the overall result. What is the reason for the share price sitting below the intrinsic value? For Graco, we've compiled three further aspects you should assess:
- Financial Health: Does GGG have a healthy balance sheet? Take a look at our free balance sheet analysis with six simple checks on key factors like leverage and risk.
- Future Earnings: How does GGG's growth rate compare to its peers and the wider market? Dig deeper into the analyst consensus number for the upcoming years by interacting with our free analyst growth expectation chart.
- Other Solid Businesses: Low debt, high returns on equity and good past performance are fundamental to a strong business. Why not explore our interactive list of stocks with solid business fundamentals to see if there are other companies you may not have considered!
PS. The Simply Wall St app conducts a discounted cash flow valuation for every stock on the NYSE every day. If you want to find the calculation for other stocks just search here.
New: Manage All Your Stock Portfolios in One Place
We've created the ultimate portfolio companion for stock investors, and it's free.
• Connect an unlimited number of Portfolios and see your total in one currency
• Be alerted to new Warning Signs or Risks via email or mobile
• Track the Fair Value of your stocks
Have feedback on this article? Concerned about the content? Get in touch with us directly. Alternatively, email editorial-team (at) simplywallst.com.
This article by Simply Wall St is general in nature. We provide commentary based on historical data and analyst forecasts only using an unbiased methodology and our articles are not intended to be financial advice. It does not constitute a recommendation to buy or sell any stock, and does not take account of your objectives, or your financial situation. We aim to bring you long-term focused analysis driven by fundamental data. Note that our analysis may not factor in the latest price-sensitive company announcements or qualitative material. Simply Wall St has no position in any stocks mentioned.
Have feedback on this article? Concerned about the content? Get in touch with us directly. Alternatively, email editorial-team@simplywallst.com
About NYSE:GGG
Graco
Designs, manufactures, and markets systems and equipment used to move, measure, mix, control, dispense, and spray fluid and powder materials in the Americas, Europe, the Middle East, Africa, and the Asia Pacific.
Flawless balance sheet average dividend payer.
Similar Companies
Market Insights

Advertisement
Community Narratives
Pinterest will surge as advertising innovations ignite revenue growth
Fair Value US$42.63|26.1% undervalued
BR
Community Contributor
Brambles' Revenue Set to Climb 14% with Profit Margins Following
Fair Value AU$21.90|4.8% overvalued
RO
Community Contributor
Challenging Future for STG as Organic Sales Decline by 8.8%
Fair Value DKK 116.13|27.0% undervalued
KA
Community Contributor