Advertisement
- United States
- /
- Aerospace & Defense
- /
- NYSE:ATI
ATI (ATI): Exploring Current Valuation After a Year of Steady Share Price Gains

Simply Wall St
Reviewed by Kshitija Bhandaru
ATI (ATI) has caught investor attention with a steady performance over the past year, gaining almost 25% and delivering strong growth in both revenue and net income. The company’s trajectory sparks further interest, especially given the current market conditions.
See our latest analysis for ATI.
ATI’s share price has trended steadily upward over the last year, reflecting improving fundamentals and a healthy appetite for growth stocks in the market. The recent performance is marked by a 1-year total shareholder return of 24.9 percent, with momentum still holding strong in 2024.
If ATI’s resilience has you wondering what other strong performers are out there, consider broadening your search and discover fast growing stocks with high insider ownership
Given ATI’s impressive run, the question now is whether the current price truly reflects all the company’s upside potential or if investors could still find value before future growth is fully priced in.
Most Popular Narrative: 20.6% Undervalued
ATI’s widely followed narrative argues that its fair value stands significantly above the latest close, indicating there may be meaningful room for upside if current business drivers continue to have an effect.
Recent long-term contract expansions with both Boeing and Airbus, including new titanium alloy sheet supply and broader product offerings, lock in higher volumes and minimums, expand ATI's share, and feature inflation pass-through and attractive pricing. These contracts directly support reliable, higher-margin revenue growth and a structurally improved earnings base through the decade.
Is ATI’s multi-year pricing power really that strong? The numbers behind this valuation rely on a rare blend of locked-in supply deals, bolder earnings projections, and margin upgrades by skeptical analysts. What game-changing assumptions underline this optimism? Read on and find out.
Result: Fair Value of $102.43 (UNDERVALUED)
Have a read of the narrative in full and understand what's behind the forecasts.
However, ATI’s heavy dependence on a small group of aerospace clients and ongoing global trade tensions could quickly threaten its upbeat growth story.
Find out about the key risks to this ATI narrative.
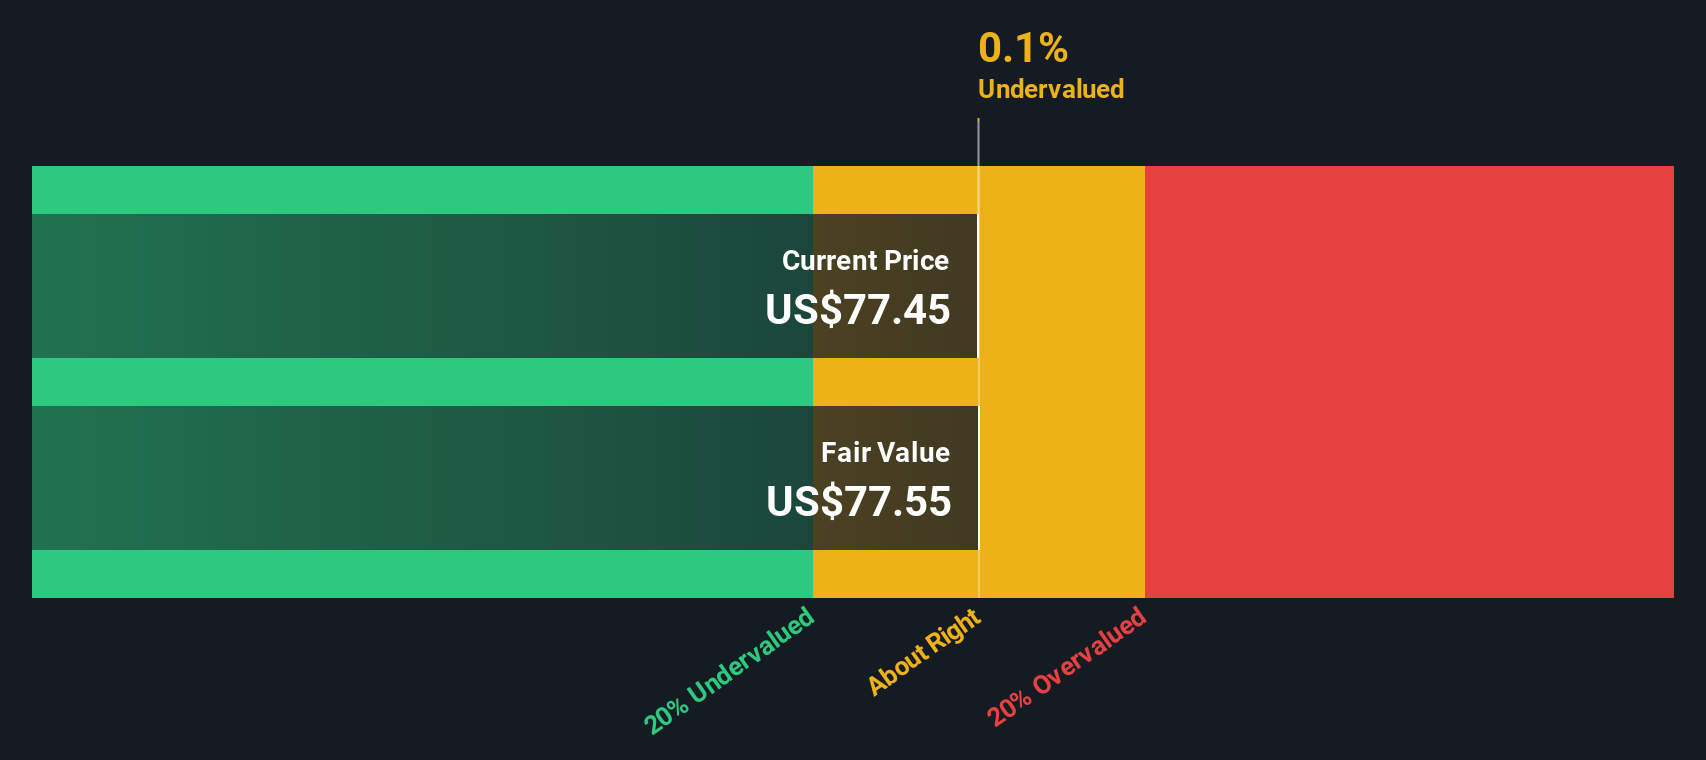
Another View: Discounted Cash Flow Perspective
While analyst price targets point to more upside for ATI, our DCF model paints a different picture. It values the company at $77.48 per share, slightly below the current market price. This suggests ATI could be fairly valued or even a touch expensive, depending on your outlook for future cash flows. However, does the market see something our DCF does not?
Look into how the SWS DCF model arrives at its fair value.
Simply Wall St performs a discounted cash flow (DCF) on every stock in the world every day (check out ATI for example). We show the entire calculation in full. You can track the result in your watchlist or portfolio and be alerted when this changes, or use our stock screener to discover undervalued stocks based on their cash flows. If you save a screener we even alert you when new companies match - so you never miss a potential opportunity.
Build Your Own ATI Narrative
If you see the story differently or want to dive into your own research, you can craft your own narrative in just a few minutes, Do it your way
A great starting point for your ATI research is our analysis highlighting 5 key rewards and 2 important warning signs that could impact your investment decision.
Looking for more investment ideas?
Smart investors keep their edge by staying ahead of the curve. Don’t wait for the crowd. Grab your next opportunity with these unique investment themes:
- Tap into the potential of market rebounders with these 896 undervalued stocks based on cash flows offering strong cash flows at attractive prices.
- Ride the AI innovation wave by tracking these 24 AI penny stocks that are disrupting industries with advanced artificial intelligence solutions.
- Secure your portfolio’s future with steady income from these 19 dividend stocks with yields > 3% boasting yields above 3 percent and reliable payouts.
This article by Simply Wall St is general in nature. We provide commentary based on historical data and analyst forecasts only using an unbiased methodology and our articles are not intended to be financial advice. It does not constitute a recommendation to buy or sell any stock, and does not take account of your objectives, or your financial situation. We aim to bring you long-term focused analysis driven by fundamental data. Note that our analysis may not factor in the latest price-sensitive company announcements or qualitative material. Simply Wall St has no position in any stocks mentioned.
New: Manage All Your Stock Portfolios in One Place
We've created the ultimate portfolio companion for stock investors, and it's free.
• Connect an unlimited number of Portfolios and see your total in one currency
• Be alerted to new Warning Signs or Risks via email or mobile
• Track the Fair Value of your stocks
Have feedback on this article? Concerned about the content? Get in touch with us directly. Alternatively, email editorial-team@simplywallst.com
About NYSE:ATI
ATI
Produces and sells specialty materials and complex components worldwide.
Good value with proven track record.
Similar Companies
Market Insights

Advertisement
Community Narratives
A formidable player in AI and enterprise computing.
Fair Value US$210.00|3.1% overvalued
CO
Community Contributor
IREN's Bold Moves in Sustainable Bitcoin Mining & AI Data Centers
Fair Value US$72.52|11.6% undervalued
BL
Community Contributor
Cooling the Champions: The Aussie Tech Behind F1's Victories
Fair Value AU$12.40|40.4% undervalued
TR
Community Contributor