- United States
- /
- Construction
- /
- NYSE:APG
What Do Recent Growth Trends Mean for APi Group Shares in 2025?

Reviewed by Bailey Pemberton
If you are thinking about what to do with your APi Group shares or whether now is the time to jump in, you are definitely not alone. This stock has caught the attention of investors with its impressive longer-term performance. Despite a slight dip of 1.3% over the past month, APi Group has soared 239.9% in the last three years and 235.2% over five years. Even year to date, the return stands at a hefty 42.9%. These are not the kind of numbers you stumble across every day, and it is no surprise that many are paying close attention to what comes next for this company.
Recent market developments have nudged risk perceptions around APi Group. However, the stock’s resilience suggests investors see structural growth potential. Short-term moves can be choppy, but the bigger picture reveals strong momentum driving interest in the company.
With so much buzz, valuation is front and center in the conversation. Is APi Group starting to look expensive after such a strong run, or is there still room to grow? According to our scorecard, where a company earns a point for each of six metrics indicating undervaluation, APi Group clocks in with a value score of 2. This suggests it appears undervalued by some measures, though perhaps not across the board.
So, how does APi Group stack up when we analyze different valuation approaches? Here, we break down the numbers using several common methods. At the end, we will look at an even more effective way to cut through the noise and understand what valuation really means for investors today.
APi Group scores just 2/6 on our valuation checks. See what other red flags we found in the full valuation breakdown.
Approach 1: APi Group Discounted Cash Flow (DCF) Analysis
The Discounted Cash Flow (DCF) model estimates a company's true worth by projecting its future cash flows and then discounting those amounts back to today's dollars. This approach helps investors gauge where the current share price stands in relation to expected cash generation over time.
For APi Group, the most recently reported Free Cash Flow is $558.9 million. According to analyst and internal projections, this figure is expected to grow over the coming years, reaching around $1.3 billion by 2035. The projections begin with specific analyst estimates for the next five years and then continue with more moderate, extrapolated growth in subsequent years. Each annual cash flow is discounted back to its present value to account for time and risk factors.
Based on these projections and using the 2 Stage Free Cash Flow to Equity method, the DCF model estimates APi Group's intrinsic share value is $41.28. This implies the stock is 17.0% undervalued compared to its current trading price.
For investors looking for a data-driven approach, the DCF analysis makes a strong case that APi Group is trading below its calculated fair value at this time.
Result: UNDERVALUED
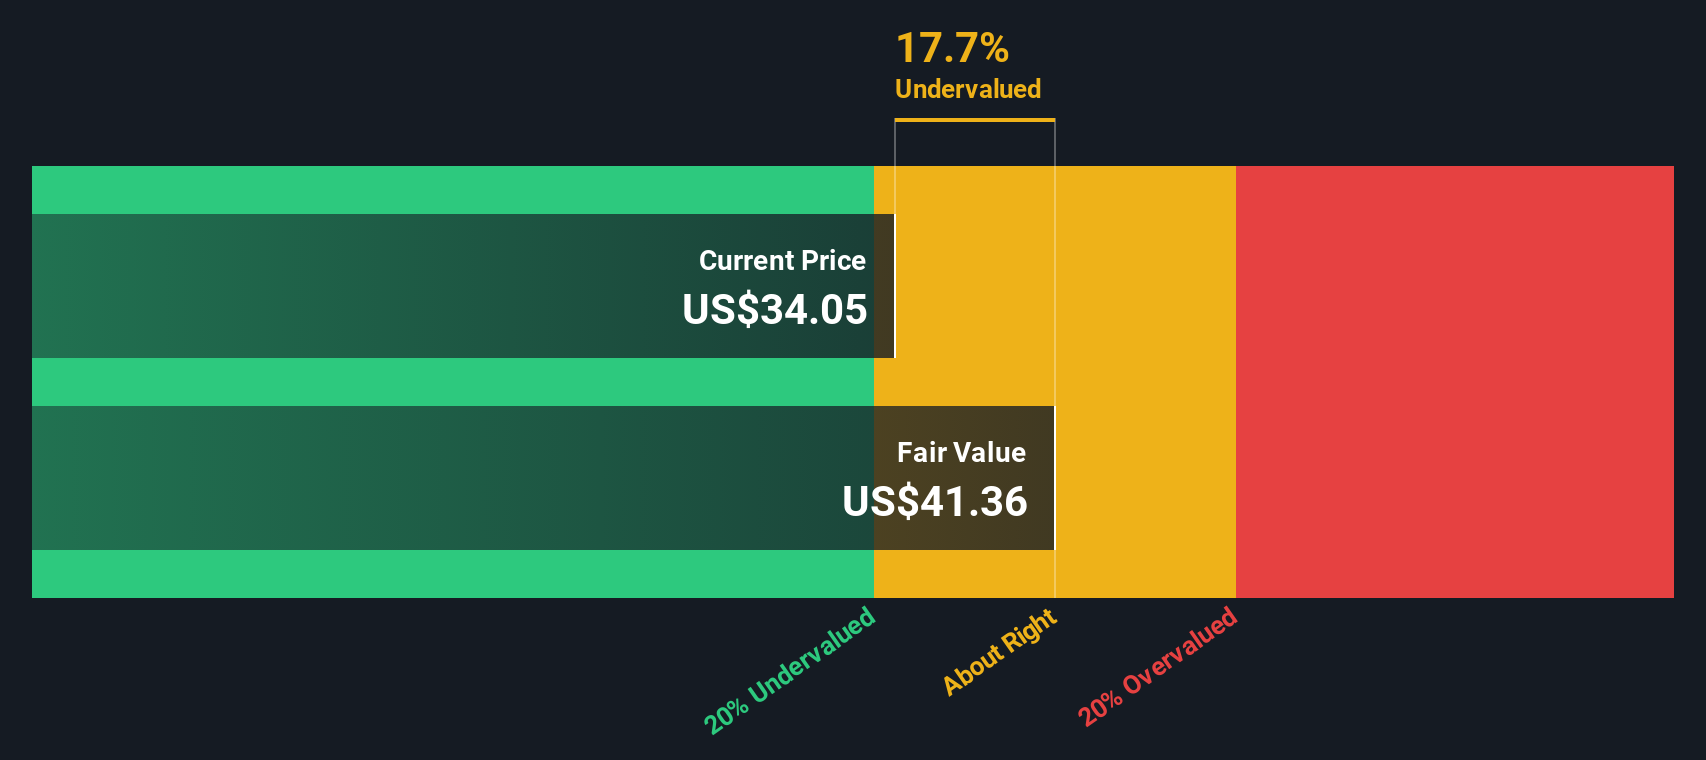
Our Discounted Cash Flow (DCF) analysis suggests APi Group is undervalued by 17.0%. Track this in your watchlist or portfolio, or discover more undervalued stocks.
Approach 2: APi Group Price vs Earnings
The Price-to-Earnings (PE) ratio is a widely used valuation tool for profitable companies, as it shows how much investors are willing to pay for each dollar of current earnings. For businesses like APi Group, which generate consistent profits, the PE ratio offers a straightforward measure to compare against the market’s expectations for growth and risk.
Growth potential and risk profile play crucial roles in determining what counts as a "normal" or "fair" PE ratio. Companies with faster expected earnings growth or lower perceived risk typically command higher multiples, while slower-growing or riskier firms trade at lower ones. Benchmarks like the industry average and peers provide useful context, but they do not tell the whole story.
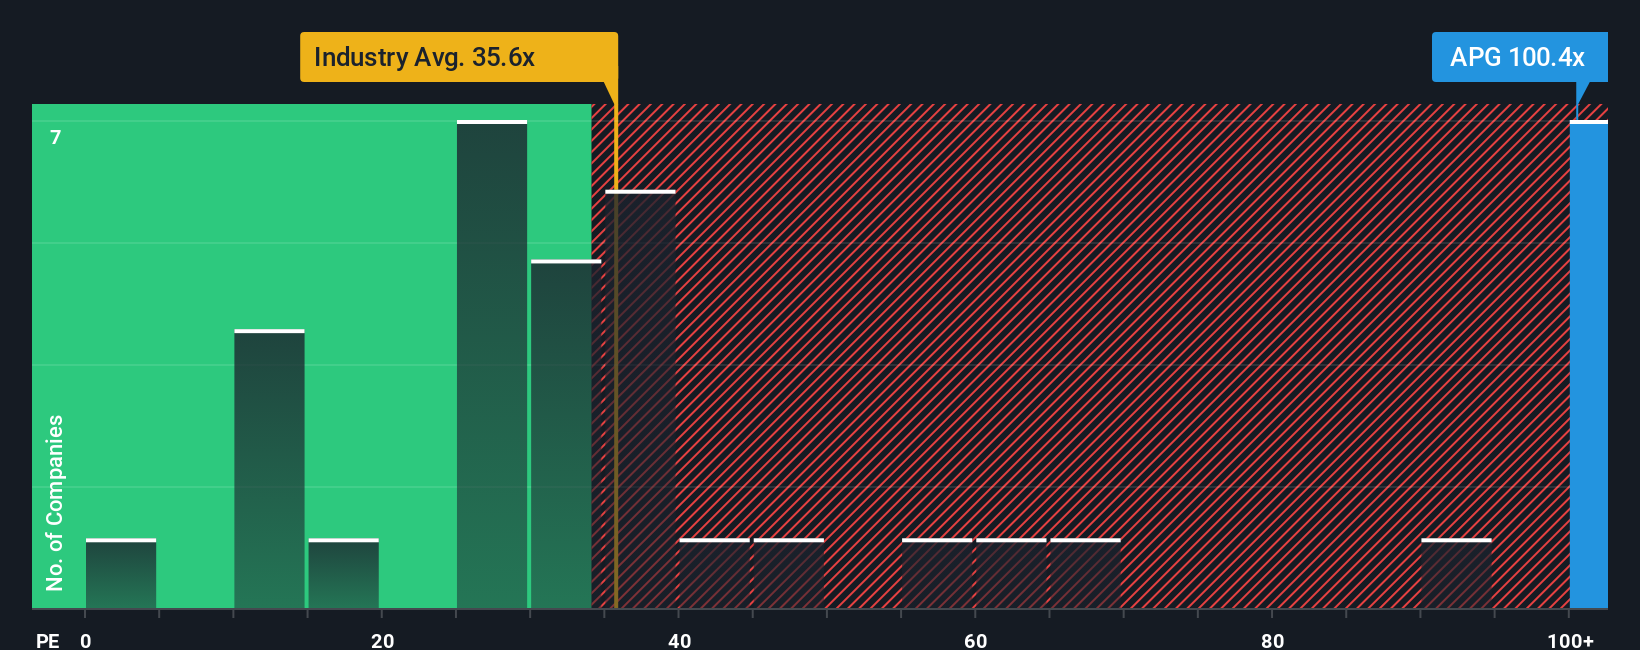
Currently, APi Group trades at a PE ratio of 101x. This stands significantly above the Construction industry average of 36x and the peer group average of 39x. On the surface, this suggests the market is expecting very robust future growth or relatively low risk compared to other industry players.
To sharpen this comparison, Simply Wall St provides a unique “Fair Ratio” in this case, a PE of 54x, calculated by considering APi Group’s specific earnings growth outlook, profit margins, risk factors, industry category and size. The Fair Ratio is more meaningful than traditional benchmarks as it assesses what a justifiable multiple for APi Group should be today, given all those nuances.
Comparing APi Group’s current PE of 101x to the Fair Ratio of 54x, it looks as though the stock is trading above what would be considered reasonable even after accounting for its growth, margins and risk. This indicates some overvaluation based on this metric alone.
Result: OVERVALUED
PE ratios tell one story, but what if the real opportunity lies elsewhere? Discover companies where insiders are betting big on explosive growth.
Upgrade Your Decision Making: Choose your APi Group Narrative
Earlier we mentioned there is an even better way to understand valuation, so let's introduce you to Narratives. A Narrative is simply a story you create around a company's outlook, combining what you believe about its future growth, profitability, and risks with the numbers you expect for revenue, margins, and fair value. Narratives let you connect the company’s business story directly to a financial forecast, helping you calculate what you think the stock is really worth today.
This tool is designed to be approachable. You can build your own Narrative for APi Group right on Simply Wall St’s Community page, where millions of investors share perspectives. Narratives make it easy to decide when to buy or sell, since you can instantly compare your Fair Value to the latest Price. Your scenario will update automatically as new earnings or market news arrive.
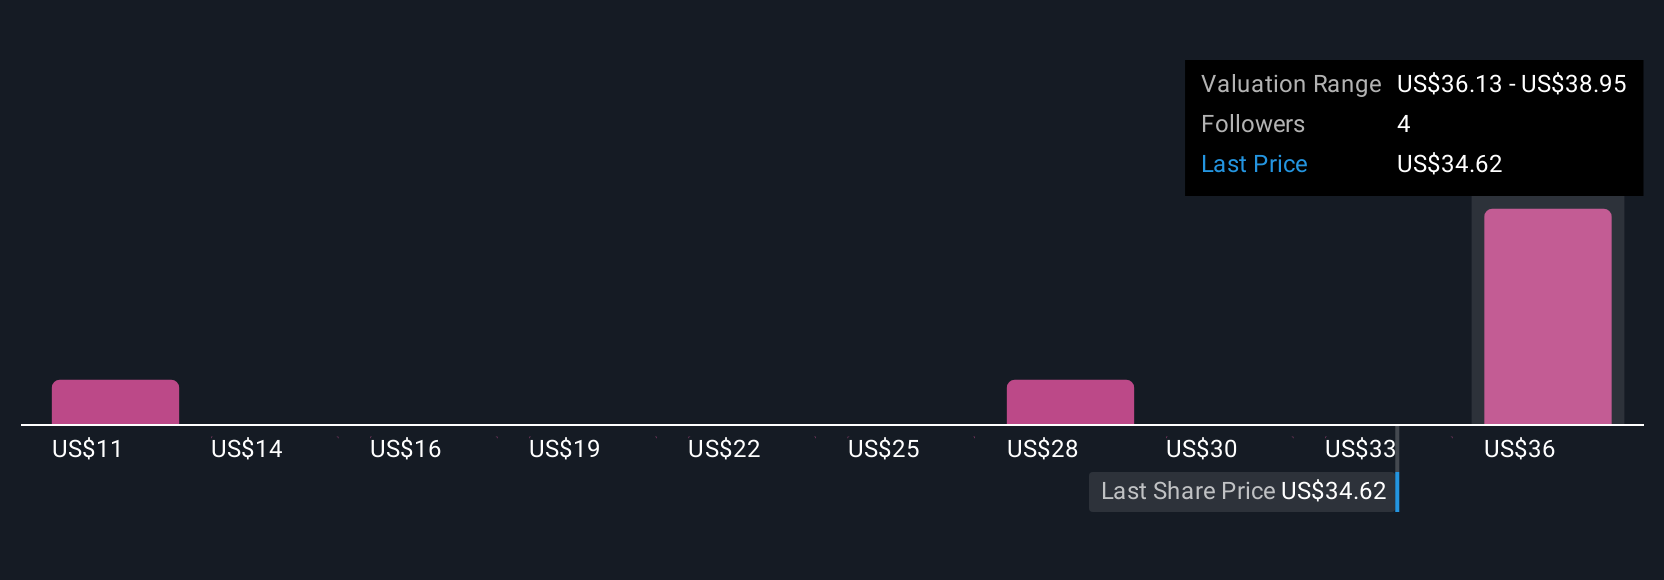
For example, one investor might see APi Group’s steady expansion in recurring revenue and digital transformation as core strengths, leading to a fair value of $41 per share. Another could be more cautious due to integration challenges and margin pressures, pegging fair value at just $32. Narratives let you put your own belief into action, all with the latest data at your fingertips.
Do you think there's more to the story for APi Group? Create your own Narrative to let the Community know!
This article by Simply Wall St is general in nature. We provide commentary based on historical data and analyst forecasts only using an unbiased methodology and our articles are not intended to be financial advice. It does not constitute a recommendation to buy or sell any stock, and does not take account of your objectives, or your financial situation. We aim to bring you long-term focused analysis driven by fundamental data. Note that our analysis may not factor in the latest price-sensitive company announcements or qualitative material. Simply Wall St has no position in any stocks mentioned.
The New Payments ETF Is Live on NASDAQ:
Money is moving to real-time rails, and a newly listed ETF now gives investors direct exposure. Fast settlement. Institutional custody. Simple access.
Explore how this launch could reshape portfolios
Sponsored ContentNew: Manage All Your Stock Portfolios in One Place
We've created the ultimate portfolio companion for stock investors, and it's free.
• Connect an unlimited number of Portfolios and see your total in one currency
• Be alerted to new Warning Signs or Risks via email or mobile
• Track the Fair Value of your stocks
Have feedback on this article? Concerned about the content? Get in touch with us directly. Alternatively, email editorial-team@simplywallst.com
About NYSE:APG
Moderate growth potential with acceptable track record.
Similar Companies
Market Insights

Weekly Picks

THE KINGDOM OF BROWN GOODS: WHY MGPI IS BEING CRUSHED BY INVENTORY & PRIMED FOR RESURRECTION


Why Vertical Aerospace (NYSE: EVTL) is Worth Possibly Over 13x its Current Price


The Quiet Giant That Became AI’s Power Grid
Recently Updated Narratives


A case for USD $14.81 per share based on book value. Be warned, this is a micro-cap dependent on a single mine.

Occidental Petroleum to Become Fairly Priced at $68.29 According to Future Projections

Agfa-Gevaert is a digital and materials turnaround opportunity, with growth potential in ZIRFON, but carrying legacy risks.
Popular Narratives


MicroVision will explode future revenue by 380.37% with a vision towards success


Crazy Undervalued 42 Baggers Silver Play (Active & Running Mine)


