
Advertisement
- United States
- /
- Machinery
- /
- NYSE:AIN
Are Albany International Corp.'s (NYSE:AIN) Mixed Financials Driving The Negative Sentiment?

It is hard to get excited after looking at Albany International's (NYSE:AIN) recent performance, when its stock has declined 9.1% over the past month. It seems that the market might have completely ignored the positive aspects of the company's fundamentals and decided to weigh-in more on the negative aspects. Long-term fundamentals are usually what drive market outcomes, so it's worth paying close attention. Particularly, we will be paying attention to Albany International's ROE today.
Return on Equity or ROE is a test of how effectively a company is growing its value and managing investors’ money. In short, ROE shows the profit each dollar generates with respect to its shareholder investments.
Check out our latest analysis for Albany International
How To Calculate Return On Equity?
The formula for return on equity is:
Return on Equity = Net Profit (from continuing operations) ÷ Shareholders' Equity
So, based on the above formula, the ROE for Albany International is:
9.1% = US$83m ÷ US$916m (Based on the trailing twelve months to June 2023).
The 'return' is the income the business earned over the last year. Another way to think of that is that for every $1 worth of equity, the company was able to earn $0.09 in profit.
Why Is ROE Important For Earnings Growth?
So far, we've learned that ROE is a measure of a company's profitability. Depending on how much of these profits the company reinvests or "retains", and how effectively it does so, we are then able to assess a company’s earnings growth potential. Generally speaking, other things being equal, firms with a high return on equity and profit retention, have a higher growth rate than firms that don’t share these attributes.
Albany International's Earnings Growth And 9.1% ROE
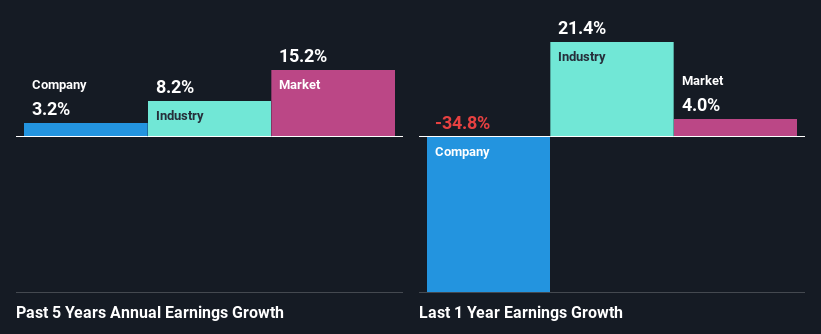
On the face of it, Albany International's ROE is not much to talk about. A quick further study shows that the company's ROE doesn't compare favorably to the industry average of 14% either. As a result, Albany International reported a very low income growth of 3.2% over the past five years.
We then compared Albany International's net income growth with the industry and found that the company's growth figure is lower than the average industry growth rate of 8.2% in the same 5-year period, which is a bit concerning.
The basis for attaching value to a company is, to a great extent, tied to its earnings growth. The investor should try to establish if the expected growth or decline in earnings, whichever the case may be, is priced in. This then helps them determine if the stock is placed for a bright or bleak future. Is AIN fairly valued? This infographic on the company's intrinsic value has everything you need to know.
Is Albany International Efficiently Re-investing Its Profits?
A low three-year median payout ratio of 22% (implying that the company retains the remaining 78% of its income) suggests that Albany International is retaining most of its profits. However, the low earnings growth number doesn't reflect this fact. So there could be some other explanation in that regard. For instance, the company's business may be deteriorating.
Additionally, Albany International has paid dividends over a period of at least ten years, which means that the company's management is determined to pay dividends even if it means little to no earnings growth. Existing analyst estimates suggest that the company's future payout ratio is expected to drop to 18% over the next three years.
Conclusion
Overall, we have mixed feelings about Albany International. While the company does have a high rate of profit retention, its low rate of return is probably hampering its earnings growth. Having said that, looking at the current analyst estimates, we found that the company's earnings are expected to gain momentum. To know more about the latest analysts predictions for the company, check out this visualization of analyst forecasts for the company.
New: Manage All Your Stock Portfolios in One Place
We've created the ultimate portfolio companion for stock investors, and it's free.
• Connect an unlimited number of Portfolios and see your total in one currency
• Be alerted to new Warning Signs or Risks via email or mobile
• Track the Fair Value of your stocks
Have feedback on this article? Concerned about the content? Get in touch with us directly. Alternatively, email editorial-team (at) simplywallst.com.
This article by Simply Wall St is general in nature. We provide commentary based on historical data and analyst forecasts only using an unbiased methodology and our articles are not intended to be financial advice. It does not constitute a recommendation to buy or sell any stock, and does not take account of your objectives, or your financial situation. We aim to bring you long-term focused analysis driven by fundamental data. Note that our analysis may not factor in the latest price-sensitive company announcements or qualitative material. Simply Wall St has no position in any stocks mentioned.
About NYSE:AIN
Albany International
Engages in the machine clothing and engineered composites businesses.
Flawless balance sheet established dividend payer.
Similar Companies
Market Insights

Advertisement
Community Narratives
Scaling up in building materials with smart M&A and growing profitability
Fair Value US$2.77|28.9% undervalued
CM
Community Contributor
Hims: The Platform Powering Personalised Healthcare
Fair Value US$114.01|46.3% undervalued
BL
Community Contributor
Undervalued lottery company with strong fundamentals
Fair Value AU$15.00|33.9% undervalued
RO
Community Contributor
Proximus, transferring money from the impatient to the patient investor
Fair Value €16.62|56.1% undervalued
AX
Community Contributor