
Advertisement
- United States
- /
- Trade Distributors
- /
- NasdaqGS:XMTR
Not Many Are Piling Into Xometry, Inc. (NASDAQ:XMTR) Stock Yet As It Plummets 26%
Unfortunately for some shareholders, the Xometry, Inc. (NASDAQ:XMTR) share price has dived 26% in the last thirty days, prolonging recent pain. The drop over the last 30 days has capped off a tough year for shareholders, with the share price down 46% in that time.
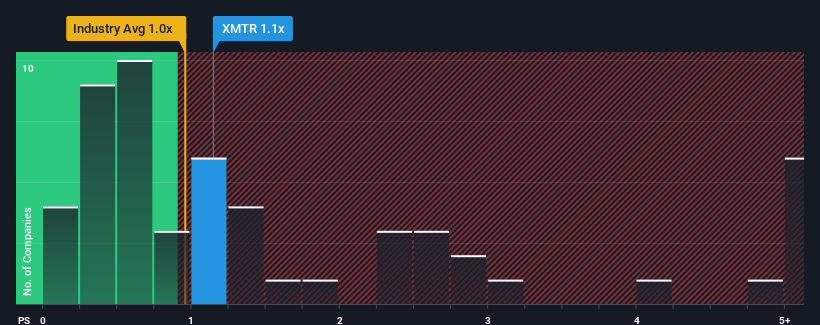
Although its price has dipped substantially, you could still be forgiven for feeling indifferent about Xometry's P/S ratio of 1.1x, since the median price-to-sales (or "P/S") ratio for the Trade Distributors industry in the United States is also close to 1x. However, investors might be overlooking a clear opportunity or potential setback if there is no rational basis for the P/S.
See our latest analysis for Xometry
How Has Xometry Performed Recently?
Recent times haven't been great for Xometry as its revenue has been rising slower than most other companies. Perhaps the market is expecting future revenue performance to lift, which has kept the P/S from declining. You'd really hope so, otherwise you're paying a relatively elevated price for a company with this sort of growth profile.
Keen to find out how analysts think Xometry's future stacks up against the industry? In that case, our free report is a great place to start.What Are Revenue Growth Metrics Telling Us About The P/S?
Xometry's P/S ratio would be typical for a company that's only expected to deliver moderate growth, and importantly, perform in line with the industry.
Retrospectively, the last year delivered an exceptional 19% gain to the company's top line. The latest three year period has also seen an excellent 203% overall rise in revenue, aided by its short-term performance. Therefore, it's fair to say the revenue growth recently has been superb for the company.
Looking ahead now, revenue is anticipated to climb by 19% per year during the coming three years according to the nine analysts following the company. Meanwhile, the rest of the industry is forecast to only expand by 6.5% each year, which is noticeably less attractive.
With this in consideration, we find it intriguing that Xometry's P/S is closely matching its industry peers. Apparently some shareholders are skeptical of the forecasts and have been accepting lower selling prices.
The Key Takeaway
Xometry's plummeting stock price has brought its P/S back to a similar region as the rest of the industry. We'd say the price-to-sales ratio's power isn't primarily as a valuation instrument but rather to gauge current investor sentiment and future expectations.
We've established that Xometry currently trades on a lower than expected P/S since its forecasted revenue growth is higher than the wider industry. When we see a strong revenue outlook, with growth outpacing the industry, we can only assume potential uncertainty around these figures are what might be placing slight pressure on the P/S ratio. This uncertainty seems to be reflected in the share price which, while stable, could be higher given the revenue forecasts.
Before you take the next step, you should know about the 1 warning sign for Xometry that we have uncovered.
If you're unsure about the strength of Xometry's business, why not explore our interactive list of stocks with solid business fundamentals for some other companies you may have missed.
New: AI Stock Screener & Alerts
Our new AI Stock Screener scans the market every day to uncover opportunities.
• Dividend Powerhouses (3%+ Yield)
• Undervalued Small Caps with Insider Buying
• High growth Tech and AI Companies
Or build your own from over 50 metrics.
Have feedback on this article? Concerned about the content? Get in touch with us directly. Alternatively, email editorial-team (at) simplywallst.com.
This article by Simply Wall St is general in nature. We provide commentary based on historical data and analyst forecasts only using an unbiased methodology and our articles are not intended to be financial advice. It does not constitute a recommendation to buy or sell any stock, and does not take account of your objectives, or your financial situation. We aim to bring you long-term focused analysis driven by fundamental data. Note that our analysis may not factor in the latest price-sensitive company announcements or qualitative material. Simply Wall St has no position in any stocks mentioned.
Have feedback on this article? Concerned about the content? Get in touch with us directly. Alternatively, email editorial-team@simplywallst.com
About NasdaqGS:XMTR
Xometry
Operates an artificial intelligence (AI) powered online manufacturing marketplace in the United States and internationally.
Mediocre balance sheet with very low risk.
Similar Companies
Market Insights

Advertisement
Community Narratives
The company that turned a verb into a global necessity and basically runs the modern internet, digital ads, smartphones, maps, and AI.
Fair Value US$300.00|5.4% undervalued
OS
Community Contributor
Flowers Foods Pays A Fair Price For Health
Fair Value US$16.12|26.3% undervalued
NV
Community Contributor
TMX Group will thrive with 33.3% profit margin and enduring market moat
Fair Value CA$49.90|4.1% overvalued
LI
Community Contributor
The "Molecular Pencil": Why Beam's Technology is Built to Win
Fair Value US$65.01|62.7% undervalued
DA
Community Contributor