- United States
- /
- Electrical
- /
- NasdaqGS:NXT
Nextracker Inc.'s (NASDAQ:NXT) Shares Climb 29% But Its Business Is Yet to Catch Up

Those holding Nextracker Inc. (NASDAQ:NXT) shares would be relieved that the share price has rebounded 29% in the last thirty days, but it needs to keep going to repair the recent damage it has caused to investor portfolios. The last 30 days bring the annual gain to a very sharp 45%.
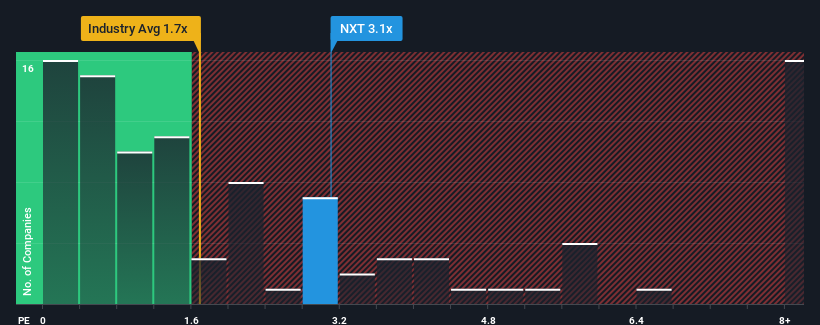
After such a large jump in price, you could be forgiven for thinking Nextracker is a stock not worth researching with a price-to-sales ratios (or "P/S") of 3.1x, considering almost half the companies in the United States' Electrical industry have P/S ratios below 1.7x. Although, it's not wise to just take the P/S at face value as there may be an explanation why it's as high as it is.
See our latest analysis for Nextracker
What Does Nextracker's P/S Mean For Shareholders?
Recent times haven't been great for Nextracker as its revenue has been rising slower than most other companies. One possibility is that the P/S ratio is high because investors think this lacklustre revenue performance will improve markedly. However, if this isn't the case, investors might get caught out paying too much for the stock.
Keen to find out how analysts think Nextracker's future stacks up against the industry? In that case, our free report is a great place to start.How Is Nextracker's Revenue Growth Trending?
The only time you'd be truly comfortable seeing a P/S as high as Nextracker's is when the company's growth is on track to outshine the industry.
If we review the last year of revenue growth, the company posted a terrific increase of 31%. The latest three year period has also seen an excellent 109% overall rise in revenue, aided by its short-term performance. Therefore, it's fair to say the revenue growth recently has been superb for the company.
Turning to the outlook, the next three years should generate growth of 13% per year as estimated by the analysts watching the company. Meanwhile, the rest of the industry is forecast to expand by 44% per annum, which is noticeably more attractive.
In light of this, it's alarming that Nextracker's P/S sits above the majority of other companies. Apparently many investors in the company are way more bullish than analysts indicate and aren't willing to let go of their stock at any price. There's a good chance these shareholders are setting themselves up for future disappointment if the P/S falls to levels more in line with the growth outlook.
The Bottom Line On Nextracker's P/S
The large bounce in Nextracker's shares has lifted the company's P/S handsomely. Using the price-to-sales ratio alone to determine if you should sell your stock isn't sensible, however it can be a practical guide to the company's future prospects.
We've concluded that Nextracker currently trades on a much higher than expected P/S since its forecast growth is lower than the wider industry. The weakness in the company's revenue estimate doesn't bode well for the elevated P/S, which could take a fall if the revenue sentiment doesn't improve. At these price levels, investors should remain cautious, particularly if things don't improve.
The company's balance sheet is another key area for risk analysis. You can assess many of the main risks through our free balance sheet analysis for Nextracker with six simple checks.
If you're unsure about the strength of Nextracker's business, why not explore our interactive list of stocks with solid business fundamentals for some other companies you may have missed.
Mobile Infrastructure for Defense and Disaster
The next wave in robotics isn't humanoid. Its fully autonomous towers delivering 5G, ISR, and radar in under 30 minutes, anywhere.
Get the investor briefing before the next round of contracts
Sponsored On Behalf of CiTechValuation is complex, but we're here to simplify it.
Discover if Nextpower might be undervalued or overvalued with our detailed analysis, featuring fair value estimates, potential risks, dividends, insider trades, and its financial condition.
Access Free AnalysisHave feedback on this article? Concerned about the content? Get in touch with us directly. Alternatively, email editorial-team (at) simplywallst.com.
This article by Simply Wall St is general in nature. We provide commentary based on historical data and analyst forecasts only using an unbiased methodology and our articles are not intended to be financial advice. It does not constitute a recommendation to buy or sell any stock, and does not take account of your objectives, or your financial situation. We aim to bring you long-term focused analysis driven by fundamental data. Note that our analysis may not factor in the latest price-sensitive company announcements or qualitative material. Simply Wall St has no position in any stocks mentioned.
About NasdaqGS:NXT
Nextpower
Provides solar tracker technologies and solutions for utility-scale and distributed generation solar applications in the United States and internationally.
Flawless balance sheet and good value.
Market Insights

Weekly Picks

THE KINGDOM OF BROWN GOODS: WHY MGPI IS BEING CRUSHED BY INVENTORY & PRIMED FOR RESURRECTION


Why Vertical Aerospace (NYSE: EVTL) is Worth Possibly Over 13x its Current Price


The Quiet Giant That Became AI’s Power Grid
Recently Updated Narratives


MINISO's fair value is projected at 26.69 with an anticipated PE ratio shift of 20x

Fiverr International will transform the freelance industry with AI-powered growth

Stride Stock: Online Education Finds Its Second Act
Popular Narratives


MicroVision will explode future revenue by 380.37% with a vision towards success


Crazy Undervalued 42 Baggers Silver Play (Active & Running Mine)


