- United States
- /
- Trade Distributors
- /
- NasdaqGS:FAST
Is Fastenal Company (NASDAQ:FAST) Worth US$63.4 Based On Its Intrinsic Value?


Key Insights
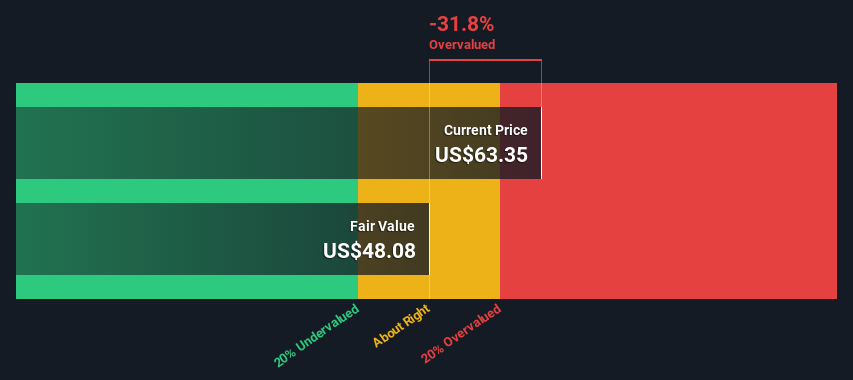
- The projected fair value for Fastenal is US$48.08 based on 2 Stage Free Cash Flow to Equity
- Current share price of US$63.35 suggests Fastenal is potentially 32% overvalued
- Analyst price target for FAST is US$58.18, which is 21% above our fair value estimate
Does the December share price for Fastenal Company (NASDAQ:FAST) reflect what it's really worth? Today, we will estimate the stock's intrinsic value by taking the expected future cash flows and discounting them to today's value. We will take advantage of the Discounted Cash Flow (DCF) model for this purpose. It may sound complicated, but actually it is quite simple!
Companies can be valued in a lot of ways, so we would point out that a DCF is not perfect for every situation. For those who are keen learners of equity analysis, the Simply Wall St analysis model here may be something of interest to you.
View our latest analysis for Fastenal
Crunching The Numbers
We use what is known as a 2-stage model, which simply means we have two different periods of growth rates for the company's cash flows. Generally the first stage is higher growth, and the second stage is a lower growth phase. In the first stage we need to estimate the cash flows to the business over the next ten years. Where possible we use analyst estimates, but when these aren't available we extrapolate the previous free cash flow (FCF) from the last estimate or reported value. We assume companies with shrinking free cash flow will slow their rate of shrinkage, and that companies with growing free cash flow will see their growth rate slow, over this period. We do this to reflect that growth tends to slow more in the early years than it does in later years.
A DCF is all about the idea that a dollar in the future is less valuable than a dollar today, so we need to discount the sum of these future cash flows to arrive at a present value estimate:
10-year free cash flow (FCF) forecast
| 2024 | 2025 | 2026 | 2027 | 2028 | 2029 | 2030 | 2031 | 2032 | 2033 | |
| Levered FCF ($, Millions) | US$994.1m | US$1.08b | US$1.20b | US$1.35b | US$1.46b | US$1.55b | US$1.62b | US$1.69b | US$1.75b | US$1.81b |
| Growth Rate Estimate Source | Analyst x9 | Analyst x9 | Analyst x4 | Analyst x2 | Est @ 7.85% | Est @ 6.16% | Est @ 4.98% | Est @ 4.15% | Est @ 3.57% | Est @ 3.17% |
| Present Value ($, Millions) Discounted @ 7.3% | US$926 | US$941 | US$969 | US$1.0k | US$1.0k | US$1.0k | US$990 | US$961 | US$927 | US$891 |
("Est" = FCF growth rate estimated by Simply Wall St)
Present Value of 10-year Cash Flow (PVCF) = US$9.7b
The second stage is also known as Terminal Value, this is the business's cash flow after the first stage. The Gordon Growth formula is used to calculate Terminal Value at a future annual growth rate equal to the 5-year average of the 10-year government bond yield of 2.2%. We discount the terminal cash flows to today's value at a cost of equity of 7.3%.
Terminal Value (TV)= FCF2033 × (1 + g) ÷ (r – g) = US$1.8b× (1 + 2.2%) ÷ (7.3%– 2.2%) = US$36b
Present Value of Terminal Value (PVTV)= TV / (1 + r)10= US$36b÷ ( 1 + 7.3%)10= US$18b
The total value, or equity value, is then the sum of the present value of the future cash flows, which in this case is US$27b. In the final step we divide the equity value by the number of shares outstanding. Relative to the current share price of US$63.4, the company appears reasonably expensive at the time of writing. Remember though, that this is just an approximate valuation, and like any complex formula - garbage in, garbage out.
The Assumptions
We would point out that the most important inputs to a discounted cash flow are the discount rate and of course the actual cash flows. Part of investing is coming up with your own evaluation of a company's future performance, so try the calculation yourself and check your own assumptions. The DCF also does not consider the possible cyclicality of an industry, or a company's future capital requirements, so it does not give a full picture of a company's potential performance. Given that we are looking at Fastenal as potential shareholders, the cost of equity is used as the discount rate, rather than the cost of capital (or weighted average cost of capital, WACC) which accounts for debt. In this calculation we've used 7.3%, which is based on a levered beta of 1.022. Beta is a measure of a stock's volatility, compared to the market as a whole. We get our beta from the industry average beta of globally comparable companies, with an imposed limit between 0.8 and 2.0, which is a reasonable range for a stable business.
SWOT Analysis for Fastenal
- Earnings growth over the past year exceeded the industry.
- Debt is not viewed as a risk.
- Dividends are covered by earnings and cash flows.
- Earnings growth over the past year is below its 5-year average.
- Dividend is low compared to the top 25% of dividend payers in the Trade Distributors market.
- Expensive based on P/E ratio and estimated fair value.
- Annual earnings are forecast to grow for the next 3 years.
- Annual earnings are forecast to grow slower than the American market.
Moving On:
Although the valuation of a company is important, it is only one of many factors that you need to assess for a company. The DCF model is not a perfect stock valuation tool. Rather it should be seen as a guide to "what assumptions need to be true for this stock to be under/overvalued?" For example, changes in the company's cost of equity or the risk free rate can significantly impact the valuation. Can we work out why the company is trading at a premium to intrinsic value? For Fastenal, there are three further items you should further examine:
- Financial Health: Does FAST have a healthy balance sheet? Take a look at our free balance sheet analysis with six simple checks on key factors like leverage and risk.
- Future Earnings: How does FAST's growth rate compare to its peers and the wider market? Dig deeper into the analyst consensus number for the upcoming years by interacting with our free analyst growth expectation chart.
- Other Solid Businesses: Low debt, high returns on equity and good past performance are fundamental to a strong business. Why not explore our interactive list of stocks with solid business fundamentals to see if there are other companies you may not have considered!
PS. Simply Wall St updates its DCF calculation for every American stock every day, so if you want to find the intrinsic value of any other stock just search here.
New: AI Stock Screener & Alerts
Our new AI Stock Screener scans the market every day to uncover opportunities.
• Dividend Powerhouses (3%+ Yield)
• Undervalued Small Caps with Insider Buying
• High growth Tech and AI Companies
Or build your own from over 50 metrics.
Have feedback on this article? Concerned about the content? Get in touch with us directly. Alternatively, email editorial-team (at) simplywallst.com.
This article by Simply Wall St is general in nature. We provide commentary based on historical data and analyst forecasts only using an unbiased methodology and our articles are not intended to be financial advice. It does not constitute a recommendation to buy or sell any stock, and does not take account of your objectives, or your financial situation. We aim to bring you long-term focused analysis driven by fundamental data. Note that our analysis may not factor in the latest price-sensitive company announcements or qualitative material. Simply Wall St has no position in any stocks mentioned.
About NasdaqGS:FAST
Fastenal
Engages in the wholesale distribution of industrial and construction supplies in the United States, Canada, Mexico, North America, and internationally.
Flawless balance sheet established dividend payer.
