- United States
- /
- Building
- /
- NasdaqGS:AAON
Earnings Troubles May Signal Larger Issues for AAON (NASDAQ:AAON) Shareholders

Investors were disappointed by AAON, Inc.'s (NASDAQ:AAON ) latest earnings release. Our analysis has found some reasons to be concerned, beyond the weak headline numbers.
Check out our latest analysis for AAON
Examining Cashflow Against AAON's Earnings
In high finance, the key ratio used to measure how well a company converts reported profits into free cash flow (FCF) is the accrual ratio (from cashflow). To get the accrual ratio we first subtract FCF from profit for a period, and then divide that number by the average operating assets for the period. You could think of the accrual ratio from cashflow as the 'non-FCF profit ratio'.
As a result, a negative accrual ratio is a positive for the company, and a positive accrual ratio is a negative. While it's not a problem to have a positive accrual ratio, indicating a certain level of non-cash profits, a high accrual ratio is arguably a bad thing, because it indicates paper profits are not matched by cash flow. That's because some academic studies have suggested that high accruals ratios tend to lead to lower profit or less profit growth.
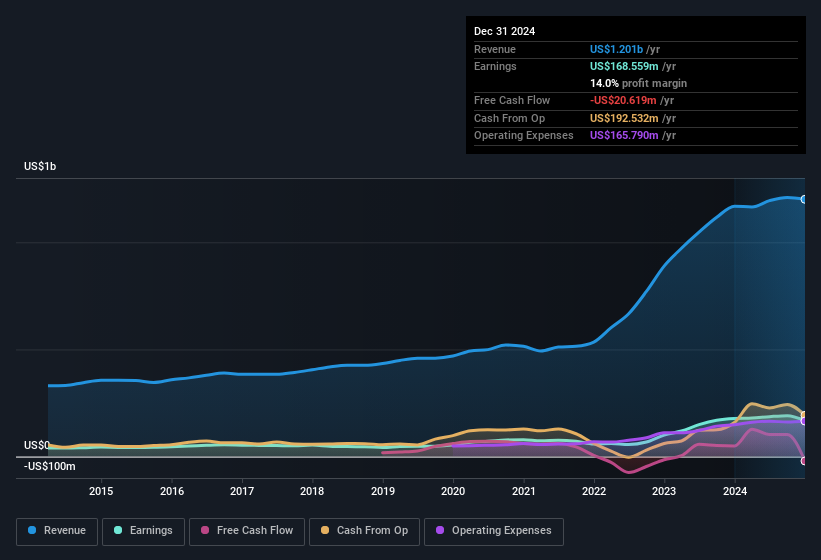
For the year to December 2024, AAON had an accrual ratio of 0.22. We can therefore deduce that its free cash flow fell well short of covering its statutory profit. In the last twelve months it actually had negative free cash flow, with an outflow of US$21m despite its profit of US$168.6m, mentioned above. It's worth noting that AAON generated positive FCF of US$49m a year ago, so at least they've done it in the past.
That might leave you wondering what analysts are forecasting in terms of future profitability. Luckily, you can click here to see an interactive graph depicting future profitability, based on their estimates.
Our Take On AAON's Profit Performance
AAON didn't convert much of its profit to free cash flow in the last year, which some investors may consider rather suboptimal. Therefore, it seems possible to us that AAON's true underlying earnings power is actually less than its statutory profit. But on the bright side, its earnings per share have grown at an extremely impressive rate over the last three years. At the end of the day, it's essential to consider more than just the factors above, if you want to understand the company properly. So while earnings quality is important, it's equally important to consider the risks facing AAON at this point in time. Case in point: We've spotted 2 warning signs for AAON you should be mindful of and 1 of these shouldn't be ignored.
This note has only looked at a single factor that sheds light on the nature of AAON's profit. But there is always more to discover if you are capable of focussing your mind on minutiae. Some people consider a high return on equity to be a good sign of a quality business. So you may wish to see this free collection of companies boasting high return on equity, or this list of stocks with high insider ownership.
The New Payments ETF Is Live on NASDAQ:
Money is moving to real-time rails, and a newly listed ETF now gives investors direct exposure. Fast settlement. Institutional custody. Simple access.
Explore how this launch could reshape portfolios
Sponsored ContentNew: Manage All Your Stock Portfolios in One Place
We've created the ultimate portfolio companion for stock investors, and it's free.
• Connect an unlimited number of Portfolios and see your total in one currency
• Be alerted to new Warning Signs or Risks via email or mobile
• Track the Fair Value of your stocks
Have feedback on this article? Concerned about the content? Get in touch with us directly. Alternatively, email editorial-team (at) simplywallst.com.
This article by Simply Wall St is general in nature. We provide commentary based on historical data and analyst forecasts only using an unbiased methodology and our articles are not intended to be financial advice. It does not constitute a recommendation to buy or sell any stock, and does not take account of your objectives, or your financial situation. We aim to bring you long-term focused analysis driven by fundamental data. Note that our analysis may not factor in the latest price-sensitive company announcements or qualitative material. Simply Wall St has no position in any stocks mentioned.
About NasdaqGS:AAON
AAON
Engages in engineering, manufacturing, marketing, and selling air conditioning and heating equipment in the United States and Canada.
High growth potential and fair value.
Similar Companies
Market Insights

Weekly Picks

Early mover in a fast growing industry. Likely to experience share price volatility as they scale


A case for CA$31.80 (undiluted), aka 8,616% upside from CA$0.37 (an 86 bagger!).


Moderation and Stabilisation: HOLD: Fair Price based on a 4-year Cycle is $12.08
Recently Updated Narratives

A case for USD $14.81 per share based on book value. Be warned, this is a micro-cap dependent on a single mine.

Occidental Petroleum to Become Fairly Priced at $68.29 According to Future Projections

Agfa-Gevaert is a digital and materials turnaround opportunity, with growth potential in ZIRFON, but carrying legacy risks.
Popular Narratives


MicroVision will explode future revenue by 380.37% with a vision towards success


Crazy Undervalued 42 Baggers Silver Play (Active & Running Mine)


