Advertisement
- United States
- /
- Banks
- /
- NYSE:TFC
Assessing Truist Stock After June Dip and Sunbelt Expansion Strategy Moves

Simply Wall St
Reviewed by Bailey Pemberton
Deciding what to do with Truist Financial stock? You are definitely not alone; plenty of investors are eyeing this bank with a blend of curiosity and caution. After all, the share price recently closed at $41.09, and there has been some noticeable turbulence over the past month. The stock dipped 7.1% in the last week and nearly the same over the past 30 days. Yet, if you step back and look at the bigger picture, Truist Financial has eked out a small gain of 0.4% over the past year, and an almost 20% total return over the last three and five years. These moves make it clear that short-term bumps might not be telling the whole story.
What is adding fuel to the discussion now is how Truist’s valuation has shaped up as markets digest shifting economic signals and evolving sentiment about the banking sector’s risks and opportunities. Investors and analysts are debating whether recent price swings are merely noise or hinting at something more fundamental. Here is something that should catch everyone’s interest. According to a value score tally, Truist stacks up as undervalued on all six major valuation checks, giving it a full score of 6 out of 6. That is not something you see every day in the banking world.
If you are looking for a deep dive on valuation, you are in the right place. Let us walk through the numbers and methods that go into this score, and later on, we will highlight a smarter way to get to the heart of what Truist Financial is truly worth.
Why Truist Financial is lagging behind its peers
Approach 1: Truist Financial Excess Returns Analysis
The Excess Returns model estimates a company’s intrinsic value by analyzing whether it generates returns on invested capital above its cost of equity. In this approach, Truist Financial’s ability to deliver sustainable, value-creating profits for shareholders takes center stage, with growth projections grounded in analysts’ expectations.
Currently, Truist Financial has a book value of $45.70 per share and a stable earnings per share (EPS) of $4.37, according to weighted future Return on Equity estimates from 13 analysts. The cost of equity stands at $4.07 per share, meaning the bank is producing an excess return, or profit above the required cost, of $0.31 per share. Truist’s average return on equity is a solid 8.83%. Looking further ahead, the stable book value per share is forecasted to reach $49.52, based on future projections from the same analyst group.
Based on these measurements, the Excess Returns valuation model points to an intrinsic fair value of $55.47 per share. Compared to the current share price of $41.09, this implies the stock is trading at a 25.9% discount, suggesting it is meaningfully undervalued in the market right now.
Result: UNDERVALUED

Our Excess Returns analysis suggests Truist Financial is undervalued by 25.9%. Track this in your watchlist or portfolio, or discover more undervalued stocks.
Approach 2: Truist Financial Price vs Earnings
The price-to-earnings (PE) ratio is widely considered the go-to valuation metric for profitable companies like Truist Financial, since it links a company’s current share price to its earnings, which is a key measure of business performance and value creation. The PE ratio is shaped by expectations for growth, risk, and profitability. A higher ratio can often reflect investor optimism about future earnings potential or confidence in stable results, while a lower ratio could mean the market is expecting slower growth or more risk ahead.
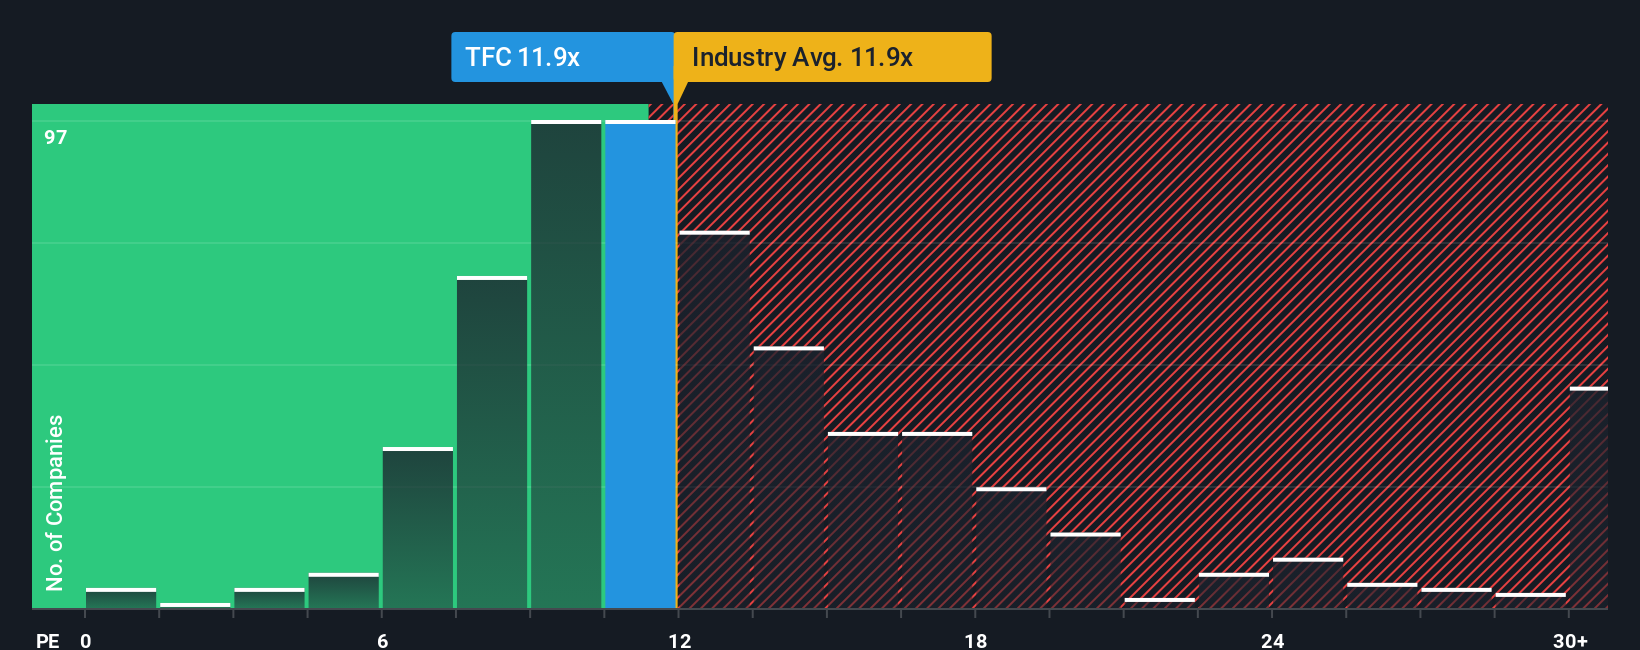
Currently, Truist Financial trades at a PE ratio of 10.8x. This sits slightly below the average PE of its direct peers at 11.6x and is also under the broader Banks industry average of 11.2x. By these measures, Truist shares are trading at a modest discount compared to similar companies.
However, Simply Wall St's proprietary "Fair Ratio" provides a more tailored perspective. The Fair Ratio, calculated at 14.3x for Truist, goes beyond simple peer or industry averages by factoring in the company’s expected earnings growth, profit margins, risk profile, market cap, and the dynamics of its specific industry. This makes it a more insightful benchmark for what the company’s valuation should actually be rather than focusing only on where similar stocks currently trade.
With Truist Financial’s actual PE ratio at 10.8x and a Fair Ratio of 14.3x, the stock appears undervalued using this approach. This suggests investors may be underestimating its earnings potential and risk-adjusted outlook.
Result: UNDERVALUED
PE ratios tell one story, but what if the real opportunity lies elsewhere? Discover companies where insiders are betting big on explosive growth.
Upgrade Your Decision Making: Choose your Truist Financial Narrative
Earlier we mentioned there is an even better way to understand valuation, so let us introduce you to Narratives. A Narrative connects your knowledge and perspective about a company to concrete financial forecasts and a fair value. It is the story you tell, with numbers behind it. With Narratives, investors combine their outlook on Truist Financial’s future revenue, profit margins, risks, and opportunities into a single, actionable viewpoint.
Narratives make valuation personal and powerful. You simply outline your view on the business, whether Truist’s Sunbelt expansion will accelerate growth or if rising costs and regulation pose bigger risks than the market expects, and the tool turns those assumptions into an updated fair value. On Simply Wall St’s Community page, Narratives are easy to create, dynamic, and used by millions of investors to track their reasoning and stay agile when news or earnings change the story.
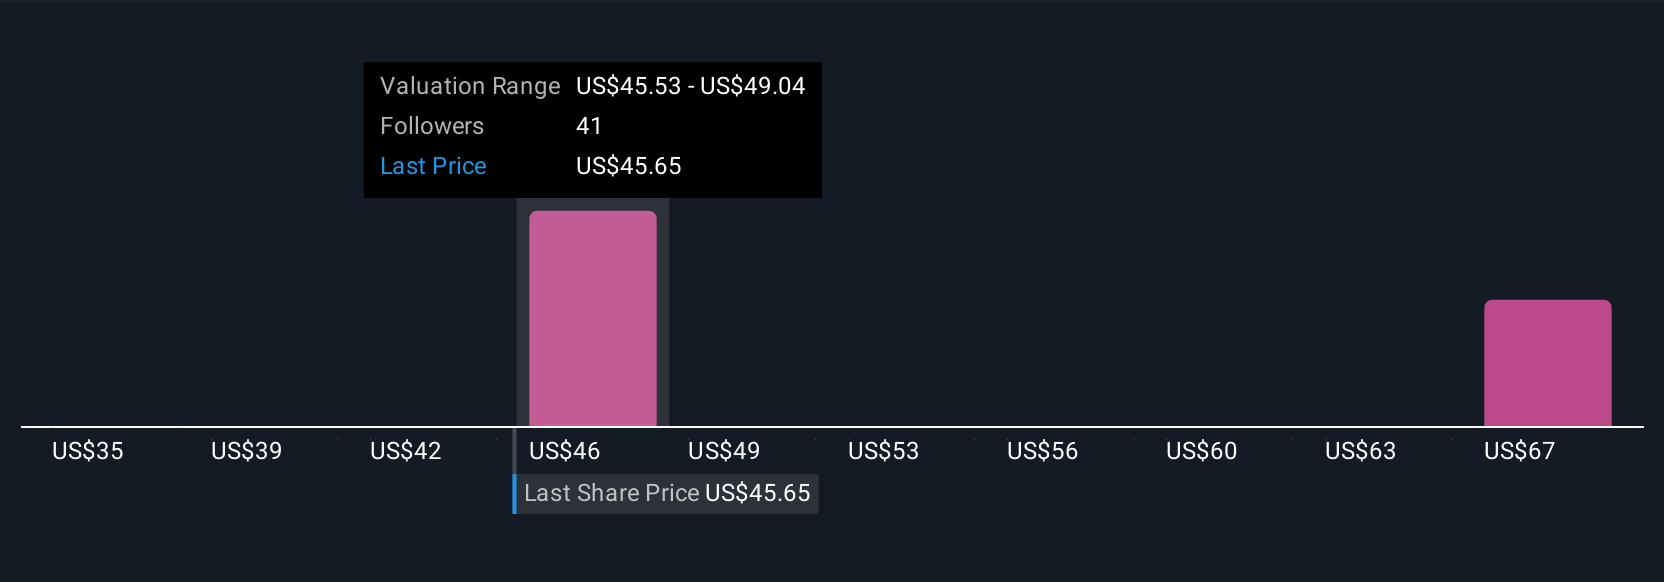
The real power comes from comparing. If your fair value based on your Narrative is above the current price, it may be a buy; if it is below, maybe it is time to sell or wait. For example, some investors currently see fair value as high as $55 on growth from digital adoption, while others are much more cautious, with estimates around $46 due to cost and regulatory pressures. With Narratives, your decisions are better informed, responsive, and truly your own.
Do you think there's more to the story for Truist Financial? Create your own Narrative to let the Community know!
This article by Simply Wall St is general in nature. We provide commentary based on historical data and analyst forecasts only using an unbiased methodology and our articles are not intended to be financial advice. It does not constitute a recommendation to buy or sell any stock, and does not take account of your objectives, or your financial situation. We aim to bring you long-term focused analysis driven by fundamental data. Note that our analysis may not factor in the latest price-sensitive company announcements or qualitative material. Simply Wall St has no position in any stocks mentioned.
Valuation is complex, but we're here to simplify it.
Discover if Truist Financial might be undervalued or overvalued with our detailed analysis, featuring fair value estimates, potential risks, dividends, insider trades, and its financial condition.
Access Free AnalysisHave feedback on this article? Concerned about the content? Get in touch with us directly. Alternatively, email editorial-team@simplywallst.com
About NYSE:TFC
Truist Financial
A financial services company, provides banking and trust services in the Southeastern and Mid-Atlantic United States.
Flawless balance sheet 6 star dividend payer.
Similar Companies
Market Insights

Advertisement
Community Narratives
Kodiak AI - a potential 100 bagger opportunity?
Fair Value US$14.00|44.7% undervalued
DA
Community Contributor
A Fair Price for a Great Business Facing Real Threats
Fair Value US$383.06|13.0% undervalued
IM
Community Contributor
AXON And Shopify Integration Will Unlock Global Mobile Advertising
Fair Value US$646.30|0% overvalued
AN
Based on Analyst Price Targets