Advertisement
- United States
- /
- Banks
- /
- NasdaqGS:TFSL
TFS Financial (TFSL): Assessing Valuation in Light of Sector Loan Quality Concerns

Simply Wall St
Reviewed by Kshitija Bhandaru
Following news that regional lenders are reporting sizable charge-offs and collateral problems, TFS Financial (TFSL) shares declined as industry fears over loan quality and future losses gained traction. Investors are watching closely as the banking climate becomes more challenging.
See our latest analysis for TFS Financial.
This latest wave of sector concerns has weighed on TFS Financial’s share price, which sits at $12.92 after a modest slip over the past month. Despite the recent headlines, the bank’s long-term record tells a different story. Total shareholder returns of 7% in the past year and nearly 30% across three years show steady compounding, even as near-term momentum feels more muted.
If you’re curious about what else is happening beyond the headlines, now’s a great moment to broaden your search and discover fast growing stocks with high insider ownership
With the stock trading below analyst price targets and mixed signals from its recent performance, the real question is whether TFS Financial presents a buying opportunity or if the market already reflects its future prospects.
Price-to-Earnings of 44x: Is it justified?
TFS Financial’s current share price of $12.92 reflects a lofty Price-to-Earnings (P/E) ratio of 44x, standing well above the norm for its sector and peers. This premium signals that investors are pricing in optimistic future earnings or granting a higher quality premium compared to the rest of the market.
The P/E ratio measures the amount investors are willing to pay for each dollar of earnings generated by the company. In banking, this figure provides direct insight into expectations around profit growth and stability. A high P/E such as 44x means the stock is commanding a much larger price tag for its earnings than comparable regional banks.
TFS Financial’s 44x multiple markedly surpasses the US banks industry average of 11.2x, as well as the peer average of 13.1x. The company’s P/E is also well above its estimated “fair” P/E ratio of 12.4x, which reflects adjustments for its business profile and sector trends. If the market realigns closer to this fair ratio, there could be a significant shift in valuation expectations.
Explore the SWS fair ratio for TFS Financial
Result: Price-to-Earnings of 44x (OVERVALUED)
However, slower revenue and net income growth may challenge current optimism, especially if banking sector volatility worsens in coming quarters.
Find out about the key risks to this TFS Financial narrative.
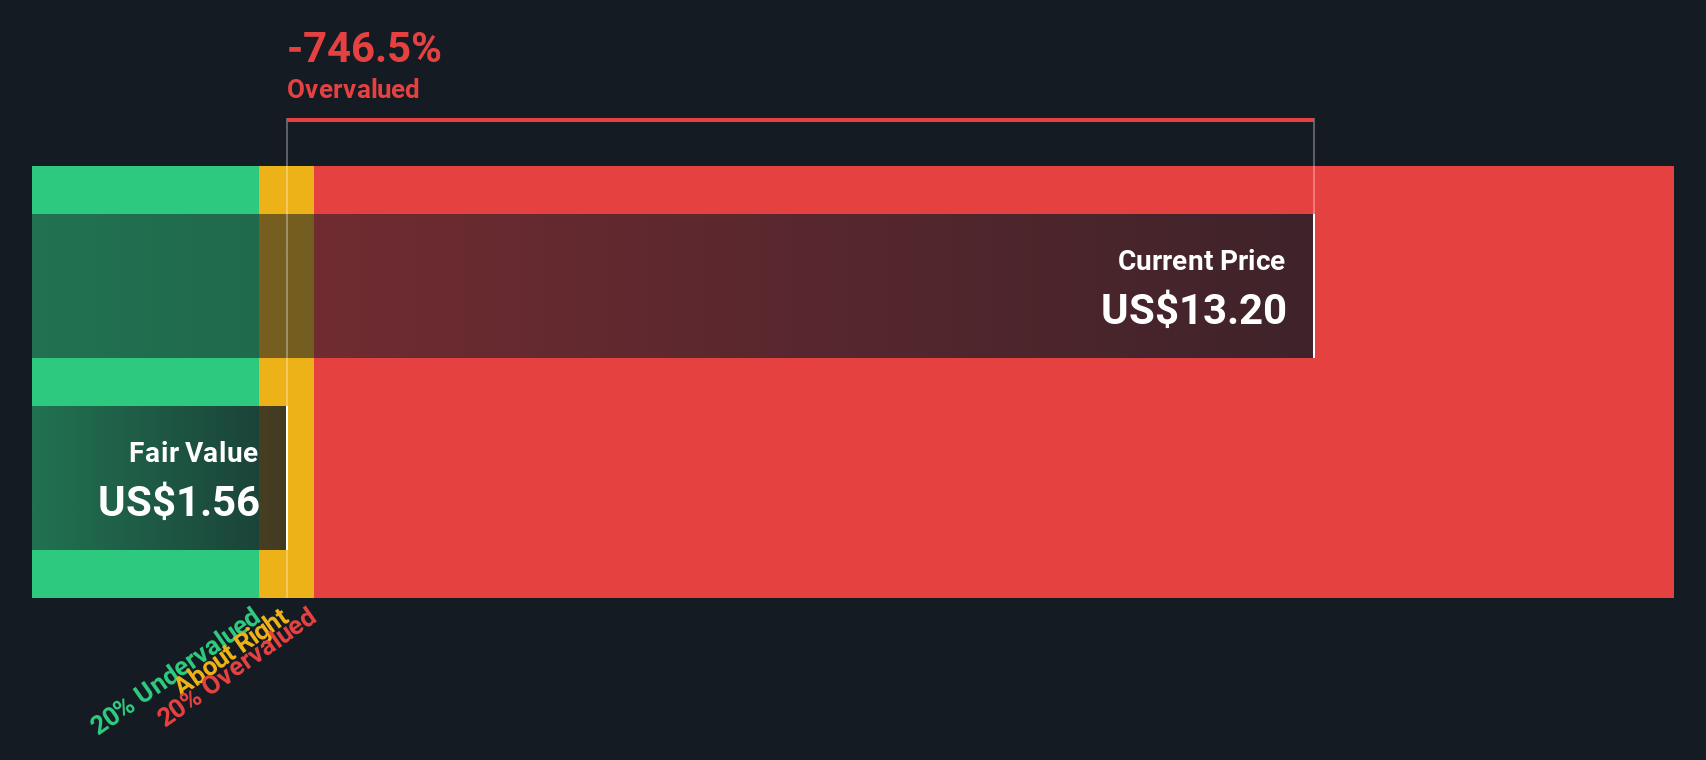
Another View: Discounted Cash Flow Paints a Harsher Picture
While the price-to-earnings ratio shows TFS Financial as potentially overvalued, our SWS DCF model draws an even starker contrast. According to this method, shares trade well above the estimate of fair value. This suggests the stock could be significantly overvalued based on future cash flow potential. Does this harsher assessment signal even greater valuation risk ahead?
Look into how the SWS DCF model arrives at its fair value.
Simply Wall St performs a discounted cash flow (DCF) on every stock in the world every day (check out TFS Financial for example). We show the entire calculation in full. You can track the result in your watchlist or portfolio and be alerted when this changes, or use our stock screener to discover undervalued stocks based on their cash flows. If you save a screener we even alert you when new companies match - so you never miss a potential opportunity.
Build Your Own TFS Financial Narrative
It’s always worth digging through the numbers yourself and coming to your own view. Building your personal thesis takes just a few minutes, so why not get started? Do it your way
A great starting point for your TFS Financial research is our analysis highlighting 1 key reward and 2 important warning signs that could impact your investment decision.
Looking for more investment ideas?
If you want to set yourself apart from the crowd and find tomorrow’s top stock stories, here is your shortcut to real opportunities other investors might be missing.
- Tap into growth by checking out these 100+ AI penny stocks, which are reshaping industries and creating new markets through artificial intelligence.
- Lock in stronger passive income as you browse these 100+ dividend stocks with yields > 3%, known for delivering consistent yields above 3% and rewarding shareholders year after year.
- Catch high-upside potential early by reviewing these 3596 penny stocks with strong financials, featuring robust financials and breakout momentum in under-the-radar sectors.
This article by Simply Wall St is general in nature. We provide commentary based on historical data and analyst forecasts only using an unbiased methodology and our articles are not intended to be financial advice. It does not constitute a recommendation to buy or sell any stock, and does not take account of your objectives, or your financial situation. We aim to bring you long-term focused analysis driven by fundamental data. Note that our analysis may not factor in the latest price-sensitive company announcements or qualitative material. Simply Wall St has no position in any stocks mentioned.
Valuation is complex, but we're here to simplify it.
Discover if TFS Financial might be undervalued or overvalued with our detailed analysis, featuring fair value estimates, potential risks, dividends, insider trades, and its financial condition.
Access Free AnalysisHave feedback on this article? Concerned about the content? Get in touch with us directly. Alternatively, email editorial-team@simplywallst.com
About NasdaqGS:TFSL
TFS Financial
Through its subsidiaries, provides retail consumer banking services in the United States.
Excellent balance sheet average dividend payer.
Similar Companies
Market Insights

Advertisement
Community Narratives
Kodiak AI - a potential 100 bagger opportunity?
Fair Value US$14.00|44.7% undervalued
DA
Community Contributor
A Fair Price for a Great Business Facing Real Threats
Fair Value US$383.06|13.0% undervalued
IM
Community Contributor
AXON And Shopify Integration Will Unlock Global Mobile Advertising
Fair Value US$646.30|7.3% undervalued
AN
Based on Analyst Price Targets