- United States
- /
- Banks
- /
- NasdaqGS:PROV
How Does Provident Financial Holdings's (NASDAQ:PROV) P/E Compare To Its Industry, After The Share Price Drop?


Unfortunately for some shareholders, the Provident Financial Holdings (NASDAQ:PROV) share price has dived 38% in the last thirty days. That drop has capped off a tough year for shareholders, with the share price down 30% in that time.
All else being equal, a share price drop should make a stock more attractive to potential investors. In the long term, share prices tend to follow earnings per share, but in the short term prices bounce around in response to short term factors (which are not always obvious). So, on certain occasions, long term focussed investors try to take advantage of pessimistic expectations to buy shares at a better price. One way to gauge market expectations of a stock is to look at its Price to Earnings Ratio (PE Ratio). A high P/E implies that investors have high expectations of what a company can achieve compared to a company with a low P/E ratio.
See our latest analysis for Provident Financial Holdings
Does Provident Financial Holdings Have A Relatively High Or Low P/E For Its Industry?
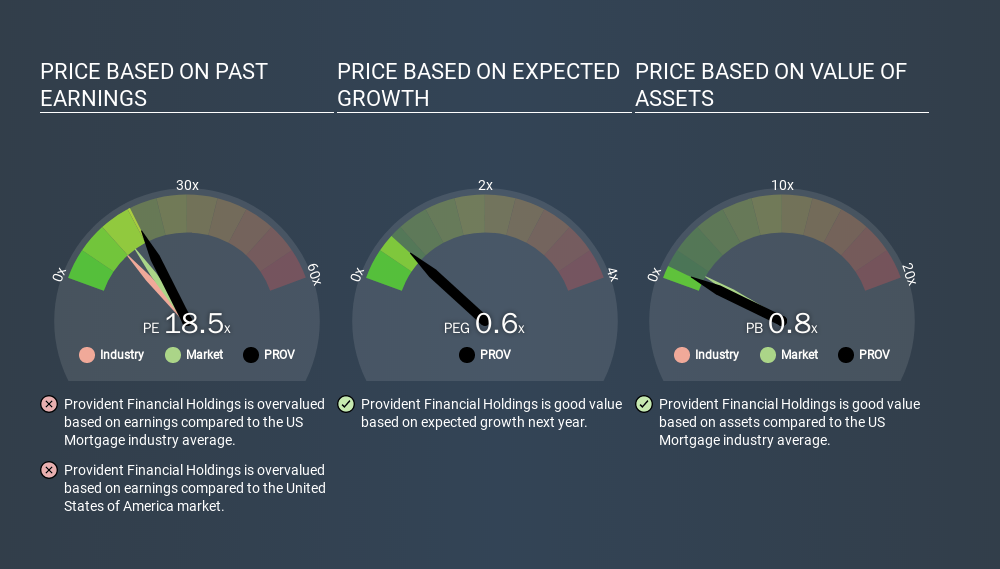
We can tell from its P/E ratio of 18.53 that there is some investor optimism about Provident Financial Holdings. You can see in the image below that the average P/E (10.9) for companies in the mortgage industry is lower than Provident Financial Holdings's P/E.
Provident Financial Holdings's P/E tells us that market participants think the company will perform better than its industry peers, going forward. Shareholders are clearly optimistic, but the future is always uncertain. So investors should always consider the P/E ratio alongside other factors, such as whether company directors have been buying shares.
How Growth Rates Impact P/E Ratios
Companies that shrink earnings per share quickly will rapidly decrease the 'E' in the equation. Therefore, even if you pay a low multiple of earnings now, that multiple will become higher in the future. A higher P/E should indicate the stock is expensive relative to others -- and that may encourage shareholders to sell.
Provident Financial Holdings shrunk earnings per share by 19% over the last year. And EPS is down 3.0% a year, over the last 5 years. This might lead to muted expectations.
Don't Forget: The P/E Does Not Account For Debt or Bank Deposits
One drawback of using a P/E ratio is that it considers market capitalization, but not the balance sheet. In other words, it does not consider any debt or cash that the company may have on the balance sheet. In theory, a company can lower its future P/E ratio by using cash or debt to invest in growth.
Such spending might be good or bad, overall, but the key point here is that you need to look at debt to understand the P/E ratio in context.
Provident Financial Holdings's Balance Sheet
Provident Financial Holdings has net debt worth 79% of its market capitalization. This is enough debt that you'd have to make some adjustments before using the P/E ratio to compare it to a company with net cash.
The Verdict On Provident Financial Holdings's P/E Ratio
Provident Financial Holdings's P/E is 18.5 which is above average (13.3) in its market. With meaningful debt and a lack of recent earnings growth, the market has high expectations that the business will earn more in the future. What can be absolutely certain is that the market has become significantly less optimistic about Provident Financial Holdings over the last month, with the P/E ratio falling from 29.7 back then to 18.5 today. For those who don't like to trade against momentum, that could be a warning sign, but a contrarian investor might want to take a closer look.
When the market is wrong about a stock, it gives savvy investors an opportunity. As value investor Benjamin Graham famously said, 'In the short run, the market is a voting machine but in the long run, it is a weighing machine. So this free visualization of the analyst consensus on future earnings could help you make the right decision about whether to buy, sell, or hold.
Of course you might be able to find a better stock than Provident Financial Holdings. So you may wish to see this free collection of other companies that have grown earnings strongly.
If you spot an error that warrants correction, please contact the editor at editorial-team@simplywallst.com. This article by Simply Wall St is general in nature. It does not constitute a recommendation to buy or sell any stock, and does not take account of your objectives, or your financial situation. Simply Wall St has no position in the stocks mentioned.
We aim to bring you long-term focused research analysis driven by fundamental data. Note that our analysis may not factor in the latest price-sensitive company announcements or qualitative material. Thank you for reading.
About NasdaqGS:PROV
Provident Financial Holdings
Operates as the holding company for Provident Savings Bank, F.S.B.
Flawless balance sheet average dividend payer.
Similar Companies
Market Insights

Community Narratives

