- United States
- /
- Auto Components
- /
- NYSE:LCII
LCI Industries (NYSE:LCII) Has A Somewhat Strained Balance Sheet

David Iben put it well when he said, 'Volatility is not a risk we care about. What we care about is avoiding the permanent loss of capital.' It's only natural to consider a company's balance sheet when you examine how risky it is, since debt is often involved when a business collapses. Importantly, LCI Industries (NYSE:LCII) does carry debt. But the more important question is: how much risk is that debt creating?
When Is Debt A Problem?
Debt assists a business until the business has trouble paying it off, either with new capital or with free cash flow. Part and parcel of capitalism is the process of 'creative destruction' where failed businesses are mercilessly liquidated by their bankers. However, a more common (but still painful) scenario is that it has to raise new equity capital at a low price, thus permanently diluting shareholders. By replacing dilution, though, debt can be an extremely good tool for businesses that need capital to invest in growth at high rates of return. The first step when considering a company's debt levels is to consider its cash and debt together.
See our latest analysis for LCI Industries
How Much Debt Does LCI Industries Carry?
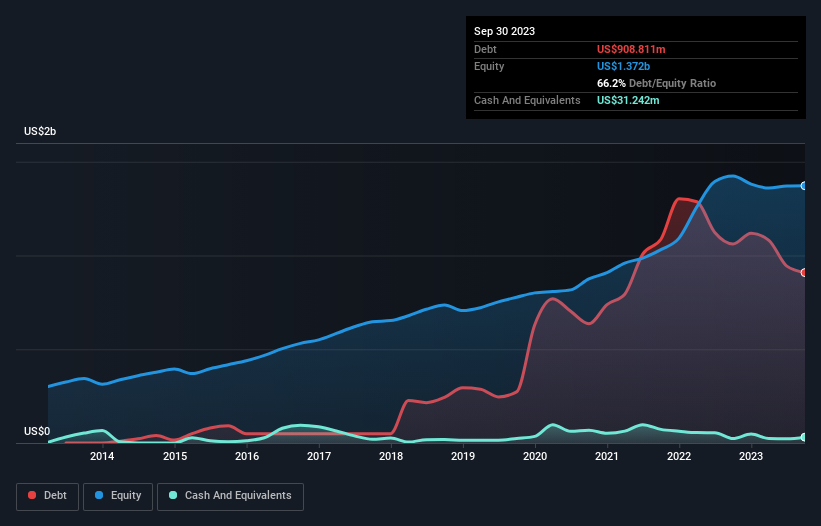
You can click the graphic below for the historical numbers, but it shows that LCI Industries had US$908.8m of debt in September 2023, down from US$1.06b, one year before. On the flip side, it has US$31.2m in cash leading to net debt of about US$877.6m.
How Healthy Is LCI Industries' Balance Sheet?
We can see from the most recent balance sheet that LCI Industries had liabilities of US$414.0m falling due within a year, and liabilities of US$1.25b due beyond that. Offsetting this, it had US$31.2m in cash and US$338.8m in receivables that were due within 12 months. So it has liabilities totalling US$1.29b more than its cash and near-term receivables, combined.
While this might seem like a lot, it is not so bad since LCI Industries has a market capitalization of US$2.93b, and so it could probably strengthen its balance sheet by raising capital if it needed to. But it's clear that we should definitely closely examine whether it can manage its debt without dilution.
In order to size up a company's debt relative to its earnings, we calculate its net debt divided by its earnings before interest, tax, depreciation, and amortization (EBITDA) and its earnings before interest and tax (EBIT) divided by its interest expense (its interest cover). The advantage of this approach is that we take into account both the absolute quantum of debt (with net debt to EBITDA) and the actual interest expenses associated with that debt (with its interest cover ratio).
While we wouldn't worry about LCI Industries's net debt to EBITDA ratio of 3.8, we think its super-low interest cover of 2.5 times is a sign of high leverage. It seems that the business incurs large depreciation and amortisation charges, so maybe its debt load is heavier than it would first appear, since EBITDA is arguably a generous measure of earnings. It seems clear that the cost of borrowing money is negatively impacting returns for shareholders, of late. Even worse, LCI Industries saw its EBIT tank 86% over the last 12 months. If earnings continue to follow that trajectory, paying off that debt load will be harder than convincing us to run a marathon in the rain. There's no doubt that we learn most about debt from the balance sheet. But it is future earnings, more than anything, that will determine LCI Industries's ability to maintain a healthy balance sheet going forward. So if you're focused on the future you can check out this free report showing analyst profit forecasts.
Finally, a company can only pay off debt with cold hard cash, not accounting profits. So the logical step is to look at the proportion of that EBIT that is matched by actual free cash flow. Over the most recent three years, LCI Industries recorded free cash flow worth 52% of its EBIT, which is around normal, given free cash flow excludes interest and tax. This free cash flow puts the company in a good position to pay down debt, when appropriate.
Our View
Mulling over LCI Industries's attempt at (not) growing its EBIT, we're certainly not enthusiastic. But on the bright side, its conversion of EBIT to free cash flow is a good sign, and makes us more optimistic. Looking at the bigger picture, it seems clear to us that LCI Industries's use of debt is creating risks for the company. If all goes well, that should boost returns, but on the flip side, the risk of permanent capital loss is elevated by the debt. The balance sheet is clearly the area to focus on when you are analysing debt. However, not all investment risk resides within the balance sheet - far from it. We've identified 4 warning signs with LCI Industries (at least 1 which shouldn't be ignored) , and understanding them should be part of your investment process.
At the end of the day, it's often better to focus on companies that are free from net debt. You can access our special list of such companies (all with a track record of profit growth). It's free.
Mobile Infrastructure for Defense and Disaster
The next wave in robotics isn't humanoid. Its fully autonomous towers delivering 5G, ISR, and radar in under 30 minutes, anywhere.
Get the investor briefing before the next round of contracts
Sponsored On Behalf of CiTechNew: AI Stock Screener & Alerts
Our new AI Stock Screener scans the market every day to uncover opportunities.
• Dividend Powerhouses (3%+ Yield)
• Undervalued Small Caps with Insider Buying
• High growth Tech and AI Companies
Or build your own from over 50 metrics.
Have feedback on this article? Concerned about the content? Get in touch with us directly. Alternatively, email editorial-team (at) simplywallst.com.
This article by Simply Wall St is general in nature. We provide commentary based on historical data and analyst forecasts only using an unbiased methodology and our articles are not intended to be financial advice. It does not constitute a recommendation to buy or sell any stock, and does not take account of your objectives, or your financial situation. We aim to bring you long-term focused analysis driven by fundamental data. Note that our analysis may not factor in the latest price-sensitive company announcements or qualitative material. Simply Wall St has no position in any stocks mentioned.
About NYSE:LCII
LCI Industries
Manufactures and supplies engineered components for the manufacturers of recreational vehicles (RVs) and adjacent industries in the United States and internationally.
Excellent balance sheet established dividend payer.
Similar Companies
Market Insights

Weekly Picks

THE KINGDOM OF BROWN GOODS: WHY MGPI IS BEING CRUSHED BY INVENTORY & PRIMED FOR RESURRECTION


Why Vertical Aerospace (NYSE: EVTL) is Worth Possibly Over 13x its Current Price


The Quiet Giant That Became AI’s Power Grid
Recently Updated Narratives


A tech powerhouse quietly powering the world’s AI infrastructure.


Keppel DC REIT (SGX: AJBU) is a resilient gem in the data center space.
Why Vertical Aerospace (NYSE: EVTL) is Worth Possibly Over 13x its Current Price
Popular Narratives

MicroVision will explode future revenue by 380.37% with a vision towards success


Crazy Undervalued 42 Baggers Silver Play (Active & Running Mine)


