- Taiwan
- /
- Tech Hardware
- /
- TWSE:2377
Calculating The Fair Value Of Micro-Star International Co., Ltd. (TWSE:2377)

Key Insights
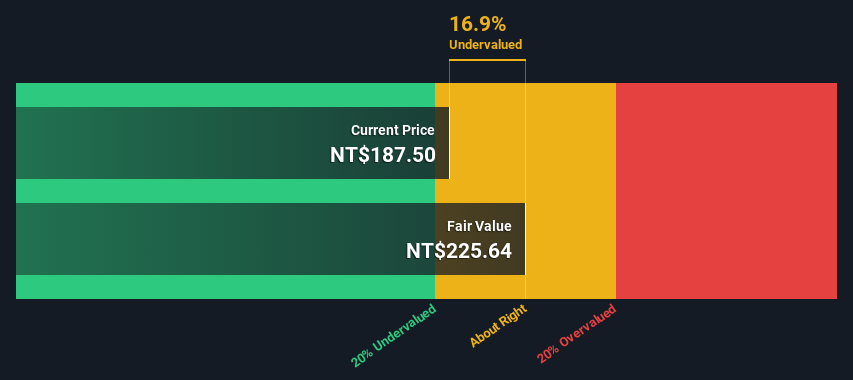
- Micro-Star International's estimated fair value is NT$226 based on 2 Stage Free Cash Flow to Equity
- Micro-Star International's NT$188 share price indicates it is trading at similar levels as its fair value estimate
- Our fair value estimate is 22% higher than Micro-Star International's analyst price target of NT$185
Does the February share price for Micro-Star International Co., Ltd. (TWSE:2377) reflect what it's really worth? Today, we will estimate the stock's intrinsic value by estimating the company's future cash flows and discounting them to their present value. One way to achieve this is by employing the Discounted Cash Flow (DCF) model. Believe it or not, it's not too difficult to follow, as you'll see from our example!
Remember though, that there are many ways to estimate a company's value, and a DCF is just one method. If you still have some burning questions about this type of valuation, take a look at the Simply Wall St analysis model.
View our latest analysis for Micro-Star International
The Model
We use what is known as a 2-stage model, which simply means we have two different periods of growth rates for the company's cash flows. Generally the first stage is higher growth, and the second stage is a lower growth phase. In the first stage we need to estimate the cash flows to the business over the next ten years. Where possible we use analyst estimates, but when these aren't available we extrapolate the previous free cash flow (FCF) from the last estimate or reported value. We assume companies with shrinking free cash flow will slow their rate of shrinkage, and that companies with growing free cash flow will see their growth rate slow, over this period. We do this to reflect that growth tends to slow more in the early years than it does in later years.
Generally we assume that a dollar today is more valuable than a dollar in the future, so we need to discount the sum of these future cash flows to arrive at a present value estimate:
10-year free cash flow (FCF) estimate
| 2024 | 2025 | 2026 | 2027 | 2028 | 2029 | 2030 | 2031 | 2032 | 2033 | |
| Levered FCF (NT$, Millions) | NT$7.63b | NT$11.6b | NT$12.2b | NT$12.6b | NT$13.0b | NT$13.3b | NT$13.5b | NT$13.7b | NT$13.9b | NT$14.0b |
| Growth Rate Estimate Source | Analyst x3 | Analyst x3 | Est @ 4.89% | Est @ 3.67% | Est @ 2.82% | Est @ 2.22% | Est @ 1.80% | Est @ 1.50% | Est @ 1.30% | Est @ 1.16% |
| Present Value (NT$, Millions) Discounted @ 7.4% | NT$7.1k | NT$10.1k | NT$9.8k | NT$9.5k | NT$9.1k | NT$8.7k | NT$8.2k | NT$7.8k | NT$7.3k | NT$6.9k |
("Est" = FCF growth rate estimated by Simply Wall St)
Present Value of 10-year Cash Flow (PVCF) = NT$84b
After calculating the present value of future cash flows in the initial 10-year period, we need to calculate the Terminal Value, which accounts for all future cash flows beyond the first stage. For a number of reasons a very conservative growth rate is used that cannot exceed that of a country's GDP growth. In this case we have used the 5-year average of the 10-year government bond yield (0.8%) to estimate future growth. In the same way as with the 10-year 'growth' period, we discount future cash flows to today's value, using a cost of equity of 7.4%.
Terminal Value (TV)= FCF2033 × (1 + g) ÷ (r – g) = NT$14b× (1 + 0.8%) ÷ (7.4%– 0.8%) = NT$216b
Present Value of Terminal Value (PVTV)= TV / (1 + r)10= NT$216b÷ ( 1 + 7.4%)10= NT$106b
The total value is the sum of cash flows for the next ten years plus the discounted terminal value, which results in the Total Equity Value, which in this case is NT$191b. The last step is to then divide the equity value by the number of shares outstanding. Relative to the current share price of NT$188, the company appears about fair value at a 17% discount to where the stock price trades currently. Remember though, that this is just an approximate valuation, and like any complex formula - garbage in, garbage out.
The Assumptions
Now the most important inputs to a discounted cash flow are the discount rate, and of course, the actual cash flows. You don't have to agree with these inputs, I recommend redoing the calculations yourself and playing with them. The DCF also does not consider the possible cyclicality of an industry, or a company's future capital requirements, so it does not give a full picture of a company's potential performance. Given that we are looking at Micro-Star International as potential shareholders, the cost of equity is used as the discount rate, rather than the cost of capital (or weighted average cost of capital, WACC) which accounts for debt. In this calculation we've used 7.4%, which is based on a levered beta of 1.195. Beta is a measure of a stock's volatility, compared to the market as a whole. We get our beta from the industry average beta of globally comparable companies, with an imposed limit between 0.8 and 2.0, which is a reasonable range for a stable business.
SWOT Analysis for Micro-Star International
- Debt is not viewed as a risk.
- Dividends are covered by earnings and cash flows.
- Earnings declined over the past year.
- Dividend is low compared to the top 25% of dividend payers in the Tech market.
- Annual earnings are forecast to grow faster than the Taiwanese market.
- Good value based on P/E ratio and estimated fair value.
- Annual revenue is forecast to grow slower than the Taiwanese market.
Next Steps:
Although the valuation of a company is important, it is only one of many factors that you need to assess for a company. It's not possible to obtain a foolproof valuation with a DCF model. Instead the best use for a DCF model is to test certain assumptions and theories to see if they would lead to the company being undervalued or overvalued. For example, changes in the company's cost of equity or the risk free rate can significantly impact the valuation. For Micro-Star International, we've put together three further factors you should further examine:
- Risks: Be aware that Micro-Star International is showing 2 warning signs in our investment analysis , you should know about...
- Future Earnings: How does 2377's growth rate compare to its peers and the wider market? Dig deeper into the analyst consensus number for the upcoming years by interacting with our free analyst growth expectation chart.
- Other Solid Businesses: Low debt, high returns on equity and good past performance are fundamental to a strong business. Why not explore our interactive list of stocks with solid business fundamentals to see if there are other companies you may not have considered!
PS. The Simply Wall St app conducts a discounted cash flow valuation for every stock on the TWSE every day. If you want to find the calculation for other stocks just search here.
The New Payments ETF Is Live on NASDAQ:
Money is moving to real-time rails, and a newly listed ETF now gives investors direct exposure. Fast settlement. Institutional custody. Simple access.
Explore how this launch could reshape portfolios
Sponsored ContentNew: Manage All Your Stock Portfolios in One Place
We've created the ultimate portfolio companion for stock investors, and it's free.
• Connect an unlimited number of Portfolios and see your total in one currency
• Be alerted to new Warning Signs or Risks via email or mobile
• Track the Fair Value of your stocks
Have feedback on this article? Concerned about the content? Get in touch with us directly. Alternatively, email editorial-team (at) simplywallst.com.
This article by Simply Wall St is general in nature. We provide commentary based on historical data and analyst forecasts only using an unbiased methodology and our articles are not intended to be financial advice. It does not constitute a recommendation to buy or sell any stock, and does not take account of your objectives, or your financial situation. We aim to bring you long-term focused analysis driven by fundamental data. Note that our analysis may not factor in the latest price-sensitive company announcements or qualitative material. Simply Wall St has no position in any stocks mentioned.
About TWSE:2377
Micro-Star International
Engages in the manufacture and sale of motherboards, interface cards, notebook computers, and other electronic products in Asia, Europe, the United States, and internationally.
Excellent balance sheet and fair value.
Similar Companies
Market Insights

Weekly Picks

THE KINGDOM OF BROWN GOODS: WHY MGPI IS BEING CRUSHED BY INVENTORY & PRIMED FOR RESURRECTION


Why Vertical Aerospace (NYSE: EVTL) is Worth Possibly Over 13x its Current Price


The Quiet Giant That Became AI’s Power Grid
Recently Updated Narratives

Jackson Financial Stock: When Insurance Math Meets a Shifting Claims Landscape

Stride Stock: Online Education Finds Its Second Act

CS Disco Stock: Legal AI Is Moving From Efficiency Tool to Competitive Necessity
Popular Narratives


MicroVision will explode future revenue by 380.37% with a vision towards success


Crazy Undervalued 42 Baggers Silver Play (Active & Running Mine)


