- Taiwan
- /
- Communications
- /
- TWSE:6674
Can You Imagine How Compal Broadband Networks' (TPE:6674) Shareholders Feel About The 40% Share Price Increase?

There's no doubt that investing in the stock market is a truly brilliant way to build wealth. But if when you choose to buy stocks, some of them will be below average performers. For example, the Compal Broadband Networks, Inc. (TPE:6674), share price is up over the last year, but its gain of 40% trails the market return. On the other hand, longer term shareholders have had a tougher run, with the stock falling 23% in three years.
View our latest analysis for Compal Broadband Networks
To paraphrase Benjamin Graham: Over the short term the market is a voting machine, but over the long term it's a weighing machine. One imperfect but simple way to consider how the market perception of a company has shifted is to compare the change in the earnings per share (EPS) with the share price movement.
During the last year Compal Broadband Networks grew its earnings per share, moving from a loss to a profit.
When a company is just on the edge of profitability it can be well worth considering other metrics in order to more precisely gauge growth (and therefore understand share price movements).
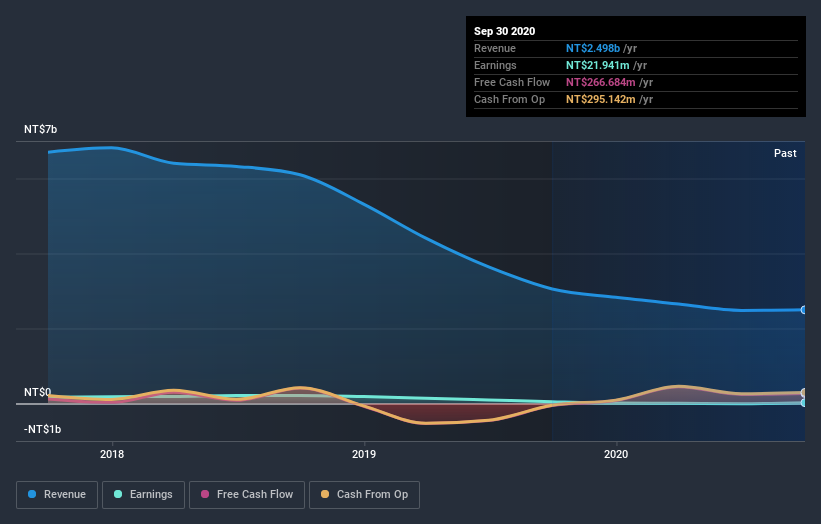
Absent any improvement, we don't think a thirst for dividends is pushing up the Compal Broadband Networks' share price. Revenue actually dropped 18% over last year. Usually that correlates with a lower share price, but let's face it, the gyrations of the market are sometimes only as clear as mud.
The company's revenue and earnings (over time) are depicted in the image below (click to see the exact numbers).
This free interactive report on Compal Broadband Networks' balance sheet strength is a great place to start, if you want to investigate the stock further.
What About Dividends?
It is important to consider the total shareholder return, as well as the share price return, for any given stock. The TSR is a return calculation that accounts for the value of cash dividends (assuming that any dividend received was reinvested) and the calculated value of any discounted capital raisings and spin-offs. It's fair to say that the TSR gives a more complete picture for stocks that pay a dividend. We note that for Compal Broadband Networks the TSR over the last year was 47%, which is better than the share price return mentioned above. This is largely a result of its dividend payments!
A Different Perspective
Compal Broadband Networks produced a TSR of 47% over the last year. It's always nice to make money but this return falls short of the market return which was about 60% for the year. The silver lining is that the recent rise is far preferable to the annual loss of 4% that shareholders have suffered over the last three years. We hope the turnaround in fortunes continues. It's always interesting to track share price performance over the longer term. But to understand Compal Broadband Networks better, we need to consider many other factors. For instance, we've identified 4 warning signs for Compal Broadband Networks (1 makes us a bit uncomfortable) that you should be aware of.
If you like to buy stocks alongside management, then you might just love this free list of companies. (Hint: insiders have been buying them).
Please note, the market returns quoted in this article reflect the market weighted average returns of stocks that currently trade on TW exchanges.
If you’re looking to trade Compal Broadband Networks, open an account with the lowest-cost* platform trusted by professionals, Interactive Brokers. Their clients from over 200 countries and territories trade stocks, options, futures, forex, bonds and funds worldwide from a single integrated account. Promoted
The New Payments ETF Is Live on NASDAQ:
Money is moving to real-time rails, and a newly listed ETF now gives investors direct exposure. Fast settlement. Institutional custody. Simple access.
Explore how this launch could reshape portfolios
Sponsored ContentNew: AI Stock Screener & Alerts
Our new AI Stock Screener scans the market every day to uncover opportunities.
• Dividend Powerhouses (3%+ Yield)
• Undervalued Small Caps with Insider Buying
• High growth Tech and AI Companies
Or build your own from over 50 metrics.
This article by Simply Wall St is general in nature. It does not constitute a recommendation to buy or sell any stock, and does not take account of your objectives, or your financial situation. We aim to bring you long-term focused analysis driven by fundamental data. Note that our analysis may not factor in the latest price-sensitive company announcements or qualitative material. Simply Wall St has no position in any stocks mentioned.
*Interactive Brokers Rated Lowest Cost Broker by StockBrokers.com Annual Online Review 2020
Have feedback on this article? Concerned about the content? Get in touch with us directly. Alternatively, email editorial-team (at) simplywallst.com.
About TWSE:6674
Compal Broadband Networks
Develops and sells networking, home security, home entertainment, and wireless accessories in Taiwan, Belgium, Turkey, the Netherlands, the United States, Brazil, Vietnam, and China.
Flawless balance sheet and slightly overvalued.
Similar Companies
Market Insights

Weekly Picks

THE KINGDOM OF BROWN GOODS: WHY MGPI IS BEING CRUSHED BY INVENTORY & PRIMED FOR RESURRECTION


Why Vertical Aerospace (NYSE: EVTL) is Worth Possibly Over 13x its Current Price


The Quiet Giant That Became AI’s Power Grid
Recently Updated Narratives


A tech powerhouse quietly powering the world’s AI infrastructure.


Keppel DC REIT (SGX: AJBU) is a resilient gem in the data center space.
Why Vertical Aerospace (NYSE: EVTL) is Worth Possibly Over 13x its Current Price
Popular Narratives

MicroVision will explode future revenue by 380.37% with a vision towards success


Crazy Undervalued 42 Baggers Silver Play (Active & Running Mine)


