- Taiwan
- /
- Electronic Equipment and Components
- /
- TWSE:5284
JPP Holding (TPE:5284) Takes On Some Risk With Its Use Of Debt

Legendary fund manager Li Lu (who Charlie Munger backed) once said, 'The biggest investment risk is not the volatility of prices, but whether you will suffer a permanent loss of capital.' So it might be obvious that you need to consider debt, when you think about how risky any given stock is, because too much debt can sink a company. We can see that JPP Holding Company Limited (TPE:5284) does use debt in its business. But should shareholders be worried about its use of debt?
When Is Debt Dangerous?
Debt and other liabilities become risky for a business when it cannot easily fulfill those obligations, either with free cash flow or by raising capital at an attractive price. In the worst case scenario, a company can go bankrupt if it cannot pay its creditors. However, a more usual (but still expensive) situation is where a company must dilute shareholders at a cheap share price simply to get debt under control. Of course, the upside of debt is that it often represents cheap capital, especially when it replaces dilution in a company with the ability to reinvest at high rates of return. The first thing to do when considering how much debt a business uses is to look at its cash and debt together.
View our latest analysis for JPP Holding
What Is JPP Holding's Debt?
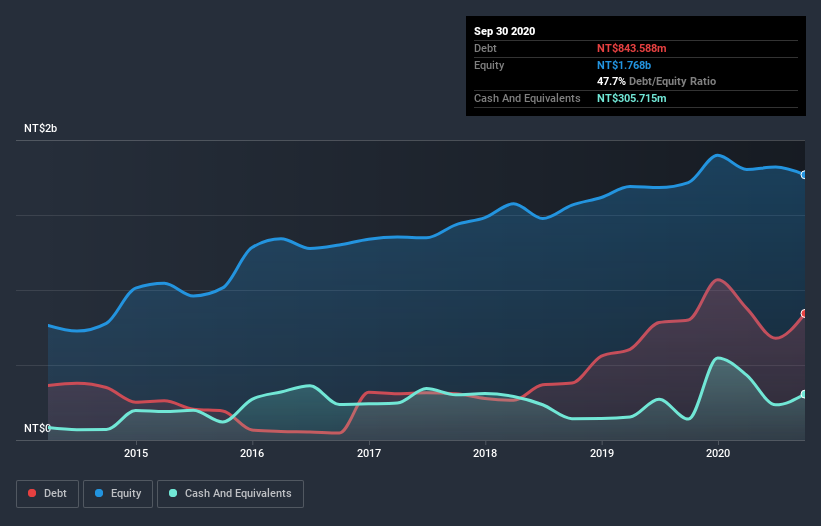
The image below, which you can click on for greater detail, shows that at September 2020 JPP Holding had debt of NT$843.6m, up from NT$800.2m in one year. On the flip side, it has NT$305.7m in cash leading to net debt of about NT$537.9m.
How Healthy Is JPP Holding's Balance Sheet?
According to the last reported balance sheet, JPP Holding had liabilities of NT$677.6m due within 12 months, and liabilities of NT$580.6m due beyond 12 months. Offsetting this, it had NT$305.7m in cash and NT$247.2m in receivables that were due within 12 months. So its liabilities total NT$705.2m more than the combination of its cash and short-term receivables.
JPP Holding has a market capitalization of NT$1.53b, so it could very likely raise cash to ameliorate its balance sheet, if the need arose. But it's clear that we should definitely closely examine whether it can manage its debt without dilution.
We use two main ratios to inform us about debt levels relative to earnings. The first is net debt divided by earnings before interest, tax, depreciation, and amortization (EBITDA), while the second is how many times its earnings before interest and tax (EBIT) covers its interest expense (or its interest cover, for short). The advantage of this approach is that we take into account both the absolute quantum of debt (with net debt to EBITDA) and the actual interest expenses associated with that debt (with its interest cover ratio).
JPP Holding's net debt is sitting at a very reasonable 2.2 times its EBITDA, while its EBIT covered its interest expense just 4.8 times last year. It seems that the business incurs large depreciation and amortisation charges, so maybe its debt load is heavier than it would first appear, since EBITDA is arguably a generous measure of earnings. Shareholders should be aware that JPP Holding's EBIT was down 29% last year. If that decline continues then paying off debt will be harder than selling foie gras at a vegan convention. The balance sheet is clearly the area to focus on when you are analysing debt. But you can't view debt in total isolation; since JPP Holding will need earnings to service that debt. So if you're keen to discover more about its earnings, it might be worth checking out this graph of its long term earnings trend.
Finally, a business needs free cash flow to pay off debt; accounting profits just don't cut it. So it's worth checking how much of that EBIT is backed by free cash flow. Over the most recent three years, JPP Holding recorded free cash flow worth 61% of its EBIT, which is around normal, given free cash flow excludes interest and tax. This free cash flow puts the company in a good position to pay down debt, when appropriate.
Our View
JPP Holding's EBIT growth rate was a real negative on this analysis, although the other factors we considered cast it in a significantly better light. For example, its conversion of EBIT to free cash flow is relatively strong. When we consider all the factors discussed, it seems to us that JPP Holding is taking some risks with its use of debt. So while that leverage does boost returns on equity, we wouldn't really want to see it increase from here. When analysing debt levels, the balance sheet is the obvious place to start. But ultimately, every company can contain risks that exist outside of the balance sheet. Consider for instance, the ever-present spectre of investment risk. We've identified 5 warning signs with JPP Holding (at least 1 which is significant) , and understanding them should be part of your investment process.
If you're interested in investing in businesses that can grow profits without the burden of debt, then check out this free list of growing businesses that have net cash on the balance sheet.
When trading JPP Holding or any other investment, use the platform considered by many to be the Professional's Gateway to the Worlds Market, Interactive Brokers. You get the lowest-cost* trading on stocks, options, futures, forex, bonds and funds worldwide from a single integrated account. Promoted
Mobile Infrastructure for Defense and Disaster
The next wave in robotics isn't humanoid. Its fully autonomous towers delivering 5G, ISR, and radar in under 30 minutes, anywhere.
Get the investor briefing before the next round of contracts
Sponsored On Behalf of CiTechNew: Manage All Your Stock Portfolios in One Place
We've created the ultimate portfolio companion for stock investors, and it's free.
• Connect an unlimited number of Portfolios and see your total in one currency
• Be alerted to new Warning Signs or Risks via email or mobile
• Track the Fair Value of your stocks
This article by Simply Wall St is general in nature. It does not constitute a recommendation to buy or sell any stock, and does not take account of your objectives, or your financial situation. We aim to bring you long-term focused analysis driven by fundamental data. Note that our analysis may not factor in the latest price-sensitive company announcements or qualitative material. Simply Wall St has no position in any stocks mentioned.
*Interactive Brokers Rated Lowest Cost Broker by StockBrokers.com Annual Online Review 2020
Have feedback on this article? Concerned about the content? Get in touch with us directly. Alternatively, email editorial-team (at) simplywallst.com.
About TWSE:5284
JPP Holding
Manufactures and sells various mechanical parts, enclosures, and electronic products for the aerospace, communication, electronics, energy, healthcare, and food industries in the Cayman Islands and internationally.
Excellent balance sheet with moderate growth potential.
Market Insights

Weekly Picks

THE KINGDOM OF BROWN GOODS: WHY MGPI IS BEING CRUSHED BY INVENTORY & PRIMED FOR RESURRECTION


Why Vertical Aerospace (NYSE: EVTL) is Worth Possibly Over 13x its Current Price


The Quiet Giant That Became AI’s Power Grid
Recently Updated Narratives


MINISO's fair value is projected at 26.69 with an anticipated PE ratio shift of 20x

Fiverr International will transform the freelance industry with AI-powered growth

Stride Stock: Online Education Finds Its Second Act
Popular Narratives


MicroVision will explode future revenue by 380.37% with a vision towards success


Crazy Undervalued 42 Baggers Silver Play (Active & Running Mine)


