
Advertisement
- Taiwan
- /
- Electronic Equipment and Components
- /
- TWSE:2355
Is Chin-Poon Industrial (TPE:2355) A Risky Investment?

Warren Buffett famously said, 'Volatility is far from synonymous with risk.' It's only natural to consider a company's balance sheet when you examine how risky it is, since debt is often involved when a business collapses. As with many other companies Chin-Poon Industrial Co., Ltd. (TPE:2355) makes use of debt. But the real question is whether this debt is making the company risky.
When Is Debt Dangerous?
Debt is a tool to help businesses grow, but if a business is incapable of paying off its lenders, then it exists at their mercy. Ultimately, if the company can't fulfill its legal obligations to repay debt, shareholders could walk away with nothing. While that is not too common, we often do see indebted companies permanently diluting shareholders because lenders force them to raise capital at a distressed price. Of course, plenty of companies use debt to fund growth, without any negative consequences. The first step when considering a company's debt levels is to consider its cash and debt together.
View our latest analysis for Chin-Poon Industrial
How Much Debt Does Chin-Poon Industrial Carry?
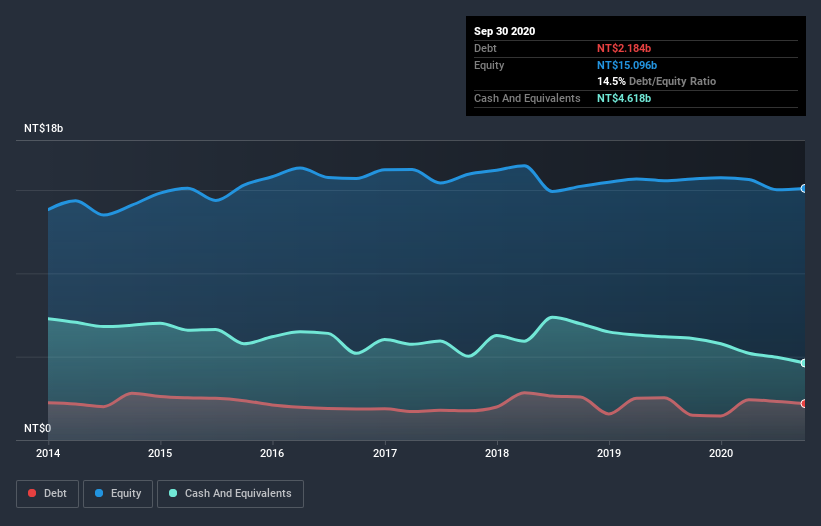
As you can see below, at the end of September 2020, Chin-Poon Industrial had NT$2.18b of debt, up from NT$1.48b a year ago. Click the image for more detail. But on the other hand it also has NT$4.62b in cash, leading to a NT$2.43b net cash position.
How Healthy Is Chin-Poon Industrial's Balance Sheet?
According to the last reported balance sheet, Chin-Poon Industrial had liabilities of NT$5.52b due within 12 months, and liabilities of NT$1.03b due beyond 12 months. Offsetting this, it had NT$4.62b in cash and NT$3.30b in receivables that were due within 12 months. So it actually has NT$1.37b more liquid assets than total liabilities.
This short term liquidity is a sign that Chin-Poon Industrial could probably pay off its debt with ease, as its balance sheet is far from stretched. Simply put, the fact that Chin-Poon Industrial has more cash than debt is arguably a good indication that it can manage its debt safely. When analysing debt levels, the balance sheet is the obvious place to start. But it is future earnings, more than anything, that will determine Chin-Poon Industrial's ability to maintain a healthy balance sheet going forward. So if you're focused on the future you can check out this free report showing analyst profit forecasts.
Over 12 months, Chin-Poon Industrial made a loss at the EBIT level, and saw its revenue drop to NT$15b, which is a fall of 14%. We would much prefer see growth.
So How Risky Is Chin-Poon Industrial?
While Chin-Poon Industrial lost money on an earnings before interest and tax (EBIT) level, it actually booked a paper profit of NT$130m. So when you consider it has net cash, along with the statutory profit, the stock probably isn't as risky as it might seem, at least in the short term. We'll feel more comfortable with the stock once EBIT is positive, given the lacklustre revenue growth. When analysing debt levels, the balance sheet is the obvious place to start. But ultimately, every company can contain risks that exist outside of the balance sheet. Consider risks, for instance. Every company has them, and we've spotted 2 warning signs for Chin-Poon Industrial you should know about.
If you're interested in investing in businesses that can grow profits without the burden of debt, then check out this free list of growing businesses that have net cash on the balance sheet.
When trading Chin-Poon Industrial or any other investment, use the platform considered by many to be the Professional's Gateway to the Worlds Market, Interactive Brokers. You get the lowest-cost* trading on stocks, options, futures, forex, bonds and funds worldwide from a single integrated account. Promoted
New: AI Stock Screener & Alerts
Our new AI Stock Screener scans the market every day to uncover opportunities.
• Dividend Powerhouses (3%+ Yield)
• Undervalued Small Caps with Insider Buying
• High growth Tech and AI Companies
Or build your own from over 50 metrics.
This article by Simply Wall St is general in nature. It does not constitute a recommendation to buy or sell any stock, and does not take account of your objectives, or your financial situation. We aim to bring you long-term focused analysis driven by fundamental data. Note that our analysis may not factor in the latest price-sensitive company announcements or qualitative material. Simply Wall St has no position in any stocks mentioned.
*Interactive Brokers Rated Lowest Cost Broker by StockBrokers.com Annual Online Review 2020
Have feedback on this article? Concerned about the content? Get in touch with us directly. Alternatively, email editorial-team@simplywallst.com.
About TWSE:2355
Chin-Poon Industrial
Engages in the manufacturing, processing, and selling of printed circuit boards (PCBs) and electronic materials in Taiwan, the United States, Germany, Japan, Hungary, Romania, China, and internationally.
Flawless balance sheet with acceptable track record.
Similar Companies
Market Insights

Advertisement
Community Narratives
Pinterest will surge as advertising innovations ignite revenue growth
Fair Value US$42.63|26.3% undervalued
BR
Community Contributor
Brambles' Revenue Set to Climb 14% with Profit Margins Following
Fair Value AU$21.90|4.9% overvalued
RO
Community Contributor
Challenging Future for STG as Organic Sales Decline by 8.8%
Fair Value DKK 116.13|26.8% undervalued
KA
Community Contributor