
David Iben put it well when he said, 'Volatility is not a risk we care about. What we care about is avoiding the permanent loss of capital.' When we think about how risky a company is, we always like to look at its use of debt, since debt overload can lead to ruin. As with many other companies Z-Com, Inc. (GTSM:8176) makes use of debt. But the real question is whether this debt is making the company risky.
When Is Debt A Problem?
Debt assists a business until the business has trouble paying it off, either with new capital or with free cash flow. If things get really bad, the lenders can take control of the business. However, a more usual (but still expensive) situation is where a company must dilute shareholders at a cheap share price simply to get debt under control. Of course, debt can be an important tool in businesses, particularly capital heavy businesses. When we think about a company's use of debt, we first look at cash and debt together.
View our latest analysis for Z-Com
How Much Debt Does Z-Com Carry?
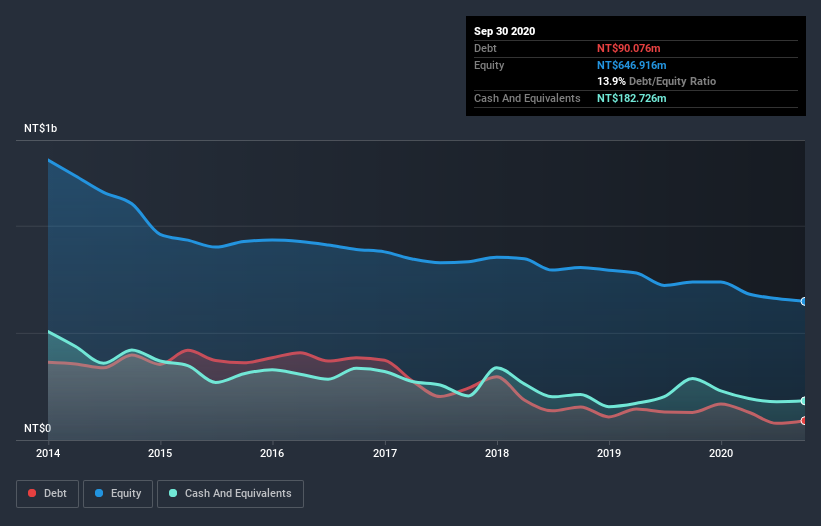
You can click the graphic below for the historical numbers, but it shows that Z-Com had NT$90.1m of debt in September 2020, down from NT$128.7m, one year before. But on the other hand it also has NT$182.7m in cash, leading to a NT$92.7m net cash position.
How Healthy Is Z-Com's Balance Sheet?
According to the last reported balance sheet, Z-Com had liabilities of NT$214.6m due within 12 months, and liabilities of NT$24.5m due beyond 12 months. Offsetting these obligations, it had cash of NT$182.7m as well as receivables valued at NT$65.3m due within 12 months. So it can boast NT$8.92m more liquid assets than total liabilities.
Having regard to Z-Com's size, it seems that its liquid assets are well balanced with its total liabilities. So it's very unlikely that the NT$644.1m company is short on cash, but still worth keeping an eye on the balance sheet. Succinctly put, Z-Com boasts net cash, so it's fair to say it does not have a heavy debt load! There's no doubt that we learn most about debt from the balance sheet. But you can't view debt in total isolation; since Z-Com will need earnings to service that debt. So if you're keen to discover more about its earnings, it might be worth checking out this graph of its long term earnings trend.
In the last year Z-Com had a loss before interest and tax, and actually shrunk its revenue by 33%, to NT$659m. To be frank that doesn't bode well.
So How Risky Is Z-Com?
We have no doubt that loss making companies are, in general, riskier than profitable ones. And the fact is that over the last twelve months Z-Com lost money at the earnings before interest and tax (EBIT) line. Indeed, in that time it burnt through NT$75m of cash and made a loss of NT$55m. Given it only has net cash of NT$92.7m, the company may need to raise more capital if it doesn't reach break-even soon. Even though its balance sheet seems sufficiently liquid, debt always makes us a little nervous if a company doesn't produce free cash flow regularly. The balance sheet is clearly the area to focus on when you are analysing debt. But ultimately, every company can contain risks that exist outside of the balance sheet. For example, we've discovered 2 warning signs for Z-Com (1 is potentially serious!) that you should be aware of before investing here.
Of course, if you're the type of investor who prefers buying stocks without the burden of debt, then don't hesitate to discover our exclusive list of net cash growth stocks, today.
If you decide to trade Z-Com, use the lowest-cost* platform that is rated #1 Overall by Barron’s, Interactive Brokers. Trade stocks, options, futures, forex, bonds and funds on 135 markets, all from a single integrated account. Promoted
Mobile Infrastructure for Defense and Disaster
The next wave in robotics isn't humanoid. Its fully autonomous towers delivering 5G, ISR, and radar in under 30 minutes, anywhere.
Get the investor briefing before the next round of contracts
Sponsored On Behalf of CiTechValuation is complex, but we're here to simplify it.
Discover if Z-Com might be undervalued or overvalued with our detailed analysis, featuring fair value estimates, potential risks, dividends, insider trades, and its financial condition.
Access Free AnalysisThis article by Simply Wall St is general in nature. It does not constitute a recommendation to buy or sell any stock, and does not take account of your objectives, or your financial situation. We aim to bring you long-term focused analysis driven by fundamental data. Note that our analysis may not factor in the latest price-sensitive company announcements or qualitative material. Simply Wall St has no position in any stocks mentioned.
*Interactive Brokers Rated Lowest Cost Broker by StockBrokers.com Annual Online Review 2020
Have feedback on this article? Concerned about the content? Get in touch with us directly. Alternatively, email editorial-team@simplywallst.com.
About TPEX:8176
Z-Com
Engages in the research, development, manufacture, and sale of wireless networking solutions in Taiwan, and Mainland China.
Flawless balance sheet with solid track record.
Similar Companies
Market Insights

Weekly Picks

THE KINGDOM OF BROWN GOODS: WHY MGPI IS BEING CRUSHED BY INVENTORY & PRIMED FOR RESURRECTION


Why Vertical Aerospace (NYSE: EVTL) is Worth Possibly Over 13x its Current Price


The Quiet Giant That Became AI’s Power Grid
Recently Updated Narratives

Butler National (Buks) outperforms.


A tech powerhouse quietly powering the world’s AI infrastructure.


Keppel DC REIT (SGX: AJBU) is a resilient gem in the data center space.
Popular Narratives

MicroVision will explode future revenue by 380.37% with a vision towards success


Crazy Undervalued 42 Baggers Silver Play (Active & Running Mine)


