- Taiwan
- /
- Electronic Equipment and Components
- /
- TPEX:5489
DynaColor, Inc.'s (GTSM:5489) Stock Going Strong But Fundamentals Look Weak: What Implications Could This Have On The Stock?

Most readers would already be aware that DynaColor's (GTSM:5489) stock increased significantly by 12% over the past three months. We, however wanted to have a closer look at its key financial indicators as the markets usually pay for long-term fundamentals, and in this case, they don't look very promising. Specifically, we decided to study DynaColor's ROE in this article.
Return on equity or ROE is an important factor to be considered by a shareholder because it tells them how effectively their capital is being reinvested. Put another way, it reveals the company's success at turning shareholder investments into profits.
View our latest analysis for DynaColor
How To Calculate Return On Equity?
The formula for ROE is:
Return on Equity = Net Profit (from continuing operations) ÷ Shareholders' Equity
So, based on the above formula, the ROE for DynaColor is:
2.7% = NT$55m ÷ NT$2.1b (Based on the trailing twelve months to September 2020).
The 'return' is the amount earned after tax over the last twelve months. Another way to think of that is that for every NT$1 worth of equity, the company was able to earn NT$0.03 in profit.
What Is The Relationship Between ROE And Earnings Growth?
Thus far, we have learned that ROE measures how efficiently a company is generating its profits. Depending on how much of these profits the company reinvests or "retains", and how effectively it does so, we are then able to assess a company’s earnings growth potential. Assuming all else is equal, companies that have both a higher return on equity and higher profit retention are usually the ones that have a higher growth rate when compared to companies that don't have the same features.
DynaColor's Earnings Growth And 2.7% ROE
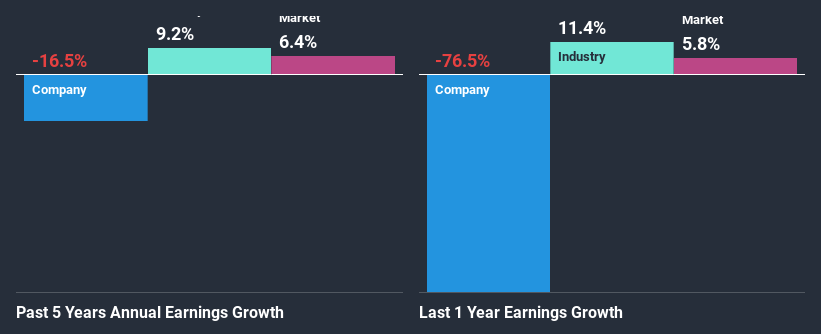
It is quite clear that DynaColor's ROE is rather low. Even when compared to the industry average of 11%, the ROE figure is pretty disappointing. For this reason, DynaColor's five year net income decline of 17% is not surprising given its lower ROE. We believe that there also might be other aspects that are negatively influencing the company's earnings prospects. Such as - low earnings retention or poor allocation of capital.
So, as a next step, we compared DynaColor's performance against the industry and were disappointed to discover that while the company has been shrinking its earnings, the industry has been growing its earnings at a rate of 9.2% in the same period.
Earnings growth is an important metric to consider when valuing a stock. The investor should try to establish if the expected growth or decline in earnings, whichever the case may be, is priced in. This then helps them determine if the stock is placed for a bright or bleak future. One good indicator of expected earnings growth is the P/E ratio which determines the price the market is willing to pay for a stock based on its earnings prospects. So, you may want to check if DynaColor is trading on a high P/E or a low P/E, relative to its industry.
Is DynaColor Making Efficient Use Of Its Profits?
With a high three-year median payout ratio of 78% (implying that 22% of the profits are retained), most of DynaColor's profits are being paid to shareholders, which explains the company's shrinking earnings. With only very little left to reinvest into the business, growth in earnings is far from likely. Our risks dashboard should have the 3 risks we have identified for DynaColor.
Moreover, DynaColor has been paying dividends for at least ten years or more suggesting that management must have perceived that the shareholders prefer dividends over earnings growth.
Summary
On the whole, DynaColor's performance is quite a big let-down. The company has seen a lack of earnings growth as a result of retaining very little profits and whatever little it does retain, is being reinvested at a very low rate of return. So far, we've only made a quick discussion around the company's earnings growth. To gain further insights into DynaColor's past profit growth, check out this visualization of past earnings, revenue and cash flows.
If you decide to trade DynaColor, use the lowest-cost* platform that is rated #1 Overall by Barron’s, Interactive Brokers. Trade stocks, options, futures, forex, bonds and funds on 135 markets, all from a single integrated account. Promoted
The New Payments ETF Is Live on NASDAQ:
Money is moving to real-time rails, and a newly listed ETF now gives investors direct exposure. Fast settlement. Institutional custody. Simple access.
Explore how this launch could reshape portfolios
Sponsored ContentNew: Manage All Your Stock Portfolios in One Place
We've created the ultimate portfolio companion for stock investors, and it's free.
• Connect an unlimited number of Portfolios and see your total in one currency
• Be alerted to new Warning Signs or Risks via email or mobile
• Track the Fair Value of your stocks
This article by Simply Wall St is general in nature. It does not constitute a recommendation to buy or sell any stock, and does not take account of your objectives, or your financial situation. We aim to bring you long-term focused analysis driven by fundamental data. Note that our analysis may not factor in the latest price-sensitive company announcements or qualitative material. Simply Wall St has no position in any stocks mentioned.
*Interactive Brokers Rated Lowest Cost Broker by StockBrokers.com Annual Online Review 2020
Have feedback on this article? Concerned about the content? Get in touch with us directly. Alternatively, email editorial-team (at) simplywallst.com.
About TPEX:5489
DynaColor
Engages in the development, manufacture, and sale of human and computer vision products for video security, machine vision systems, and robotic applications in Taiwan and internationally.
Flawless balance sheet with solid track record.
Market Insights

Weekly Picks

THE KINGDOM OF BROWN GOODS: WHY MGPI IS BEING CRUSHED BY INVENTORY & PRIMED FOR RESURRECTION


Why Vertical Aerospace (NYSE: EVTL) is Worth Possibly Over 13x its Current Price


The Quiet Giant That Became AI’s Power Grid
Recently Updated Narratives

Agfa-Gevaert is a digital and materials turnaround opportunity, with growth potential in ZIRFON, but carrying legacy risks.

Hitit Bilgisayar Hizmetleri will achieve a 19.7% revenue boost in the next five years


MINISO's fair value is projected at 26.69 with an anticipated PE ratio shift of 20x
Popular Narratives


MicroVision will explode future revenue by 380.37% with a vision towards success


Crazy Undervalued 42 Baggers Silver Play (Active & Running Mine)


