

David Iben put it well when he said, 'Volatility is not a risk we care about. What we care about is avoiding the permanent loss of capital.' So it might be obvious that you need to consider debt, when you think about how risky any given stock is, because too much debt can sink a company. Importantly, Nanya Technology Corporation (TWSE:2408) does carry debt. But is this debt a concern to shareholders?
Why Does Debt Bring Risk?
Debt and other liabilities become risky for a business when it cannot easily fulfill those obligations, either with free cash flow or by raising capital at an attractive price. Part and parcel of capitalism is the process of 'creative destruction' where failed businesses are mercilessly liquidated by their bankers. However, a more common (but still painful) scenario is that it has to raise new equity capital at a low price, thus permanently diluting shareholders. Having said that, the most common situation is where a company manages its debt reasonably well - and to its own advantage. When we examine debt levels, we first consider both cash and debt levels, together.
View our latest analysis for Nanya Technology
What Is Nanya Technology's Debt?
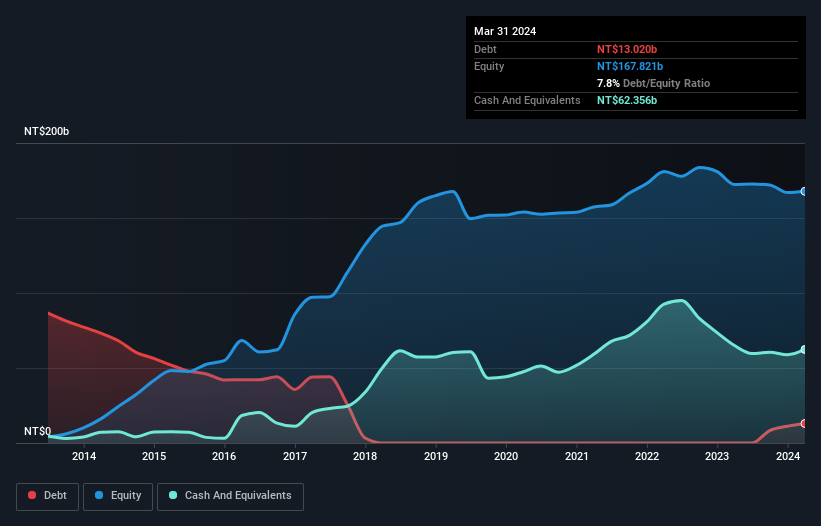
You can click the graphic below for the historical numbers, but it shows that as of March 2024 Nanya Technology had NT$13.0b of debt, an increase on none, over one year. However, its balance sheet shows it holds NT$62.4b in cash, so it actually has NT$49.3b net cash.
How Strong Is Nanya Technology's Balance Sheet?
According to the last reported balance sheet, Nanya Technology had liabilities of NT$21.9b due within 12 months, and liabilities of NT$5.39b due beyond 12 months. Offsetting this, it had NT$62.4b in cash and NT$8.66b in receivables that were due within 12 months. So it can boast NT$43.8b more liquid assets than total liabilities.
This surplus suggests that Nanya Technology is using debt in a way that is appears to be both safe and conservative. Because it has plenty of assets, it is unlikely to have trouble with its lenders. Succinctly put, Nanya Technology boasts net cash, so it's fair to say it does not have a heavy debt load! The balance sheet is clearly the area to focus on when you are analysing debt. But ultimately the future profitability of the business will decide if Nanya Technology can strengthen its balance sheet over time. So if you want to see what the professionals think, you might find this free report on analyst profit forecasts to be interesting.
Over 12 months, Nanya Technology made a loss at the EBIT level, and saw its revenue drop to NT$33b, which is a fall of 24%. To be frank that doesn't bode well.
So How Risky Is Nanya Technology?
By their very nature companies that are losing money are more risky than those with a long history of profitability. And in the last year Nanya Technology had an earnings before interest and tax (EBIT) loss, truth be told. Indeed, in that time it burnt through NT$12b of cash and made a loss of NT$7.0b. With only NT$49.3b on the balance sheet, it would appear that its going to need to raise capital again soon. Overall, its balance sheet doesn't seem overly risky, at the moment, but we're always cautious until we see the positive free cash flow. For riskier companies like Nanya Technology I always like to keep an eye on the long term profit and revenue trends. Fortunately, you can click to see our interactive graph of its profit, revenue, and operating cashflow.
If you're interested in investing in businesses that can grow profits without the burden of debt, then check out this free list of growing businesses that have net cash on the balance sheet.
If you're looking to trade Nanya Technology, open an account with the lowest-cost platform trusted by professionals, Interactive Brokers.
With clients in over 200 countries and territories, and access to 160 markets, IBKR lets you trade stocks, options, futures, forex, bonds and funds from a single integrated account.
Enjoy no hidden fees, no account minimums, and FX conversion rates as low as 0.03%, far better than what most brokers offer.
Sponsored ContentValuation is complex, but we're here to simplify it.
Discover if Nanya Technology might be undervalued or overvalued with our detailed analysis, featuring fair value estimates, potential risks, dividends, insider trades, and its financial condition.
Access Free AnalysisHave feedback on this article? Concerned about the content? Get in touch with us directly. Alternatively, email editorial-team (at) simplywallst.com.
This article by Simply Wall St is general in nature. We provide commentary based on historical data and analyst forecasts only using an unbiased methodology and our articles are not intended to be financial advice. It does not constitute a recommendation to buy or sell any stock, and does not take account of your objectives, or your financial situation. We aim to bring you long-term focused analysis driven by fundamental data. Note that our analysis may not factor in the latest price-sensitive company announcements or qualitative material. Simply Wall St has no position in any stocks mentioned.
About TWSE:2408
Nanya Technology
Research, develops, manufactures, and sells semiconductor products in Taiwan, Japan, Malaysia, China, the United States, Thailand, Germany, Singapore, Poland and internationally.
Mediocre balance sheet with limited growth.
Market Insights

Community Narratives
